

Newsletter of Danny Merkel - Issue #104

Market Review:
Another choppy and mostly flat week for the market. Momentum stocks in particular have been going sideways for a while now and have not participated one iota in this year’s rally:

While some ETFs, such as ARKK, are off to a great start this year, MTUM hasn’t budged and is actually down about 2% YTD.
This recent trading range (red lines) is taking place within the context of a much longer trading range going back to May (lightly shaded area). For example, the current price of $143 was reached in December, November, September, August, June and May.
Trading through the same price again and again is definitely not what you want from a trend following perspective.
Now you might say that this hasn’t been a good year, but at least it’s not as bad as, say, 2008 when prices collapsed.
But for trend-followers, this is much worse than 2008. To make money, we need movement, either up or down, so a year like 2008 provided plenty of movement and some absolutely incredible short-selling opportunities.
Naturally, the movement could also be on the upside and years such as 2013, 2017, and 2020 were fantastic for momentum trading.
So when will this prolonged trading range end? The answer is that I don’t know, but a powerful and objective clue would be a new 52-week-high.
Referring to the Russell 2000 Growth ETF, shown below, we can see that price was making new 52-week-highs repeatedly in late 2020. That’s a bull market. That’s movement that can be capitalized on.
However, a final high was put in mid-February 2021 (red vertical line) and there have been exactly zero new highs since then.

That’s one reason I’ve been so skeptical of these so-called “confirmed uptrends” and declarations of new bull markets. If this is a bull market, why have there been precisely zero new 52-week-highs over the past two years?
If you’re a Stockcharts.com user, you can easily add this blue zone like this:

Although I’m usually not a fan of adding indicators to a chart, this actually just helps better visualize the pure price action of new 52-week-highs and lows.
For example, notice how the blue zone ratchets down over time. As it stands now, growth stocks are getting closer to a new 52-week-high not only because price is rising, but also because the blue zone is beginning to clamp down on price action.
The same thing is also happening right now in Bitcoin. I previously discussed that if Bitcoin went to $500,000 then you could profit from $69,0000 to $500,000 by focusing on new highs.
I mentioned $69,000 for simplicity as it was the previous all-time-high, but in actuality the 52-week-high has already ratcheted down to about $32,500 (red arrow).

This leads to a very paradoxical conclusion: the new high buyer can often get in at a lower price than the dip buyer.
For instance, I noticed many Twitter traders buying the Bitcoin dip at $50,000 such as this genius on December 6th, 2021:
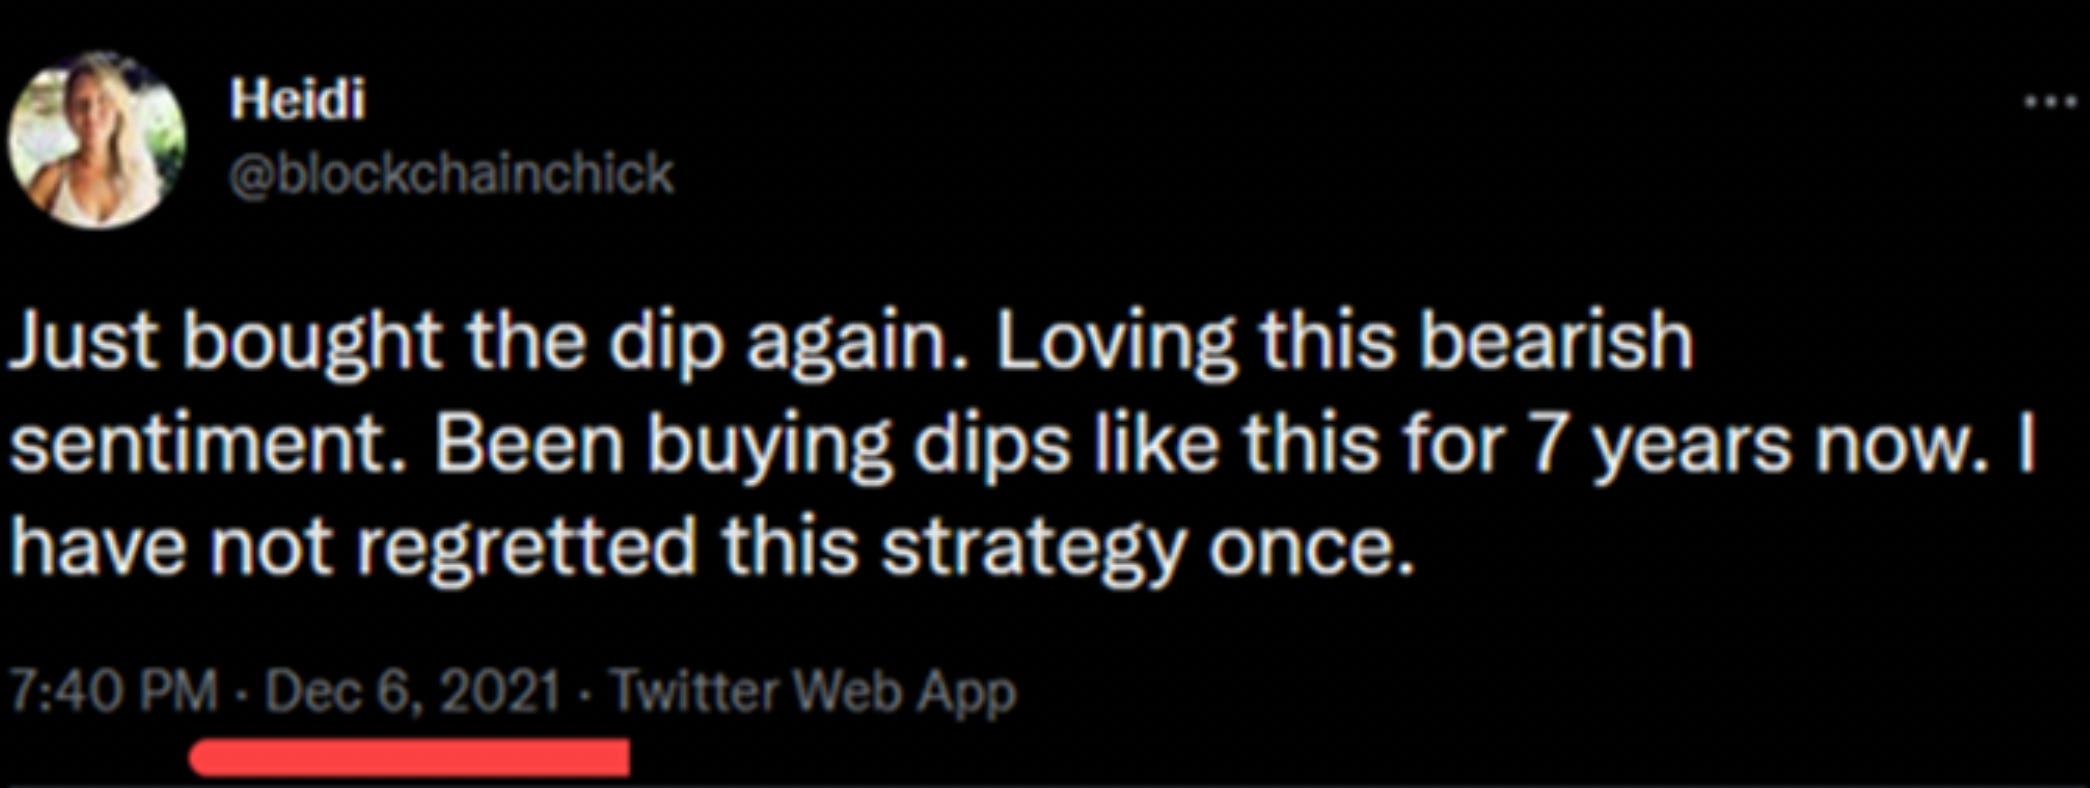
Not only does the new high buyer get in at a lower price, but their capital isn’t bogged down by holding in a downtrend for months and months.
I’ve been against dip-buying for years, but this isn’t some new theory of mine. Go back and read Jesse Livermore and you will see that he was saying the same thing a century ago:

Trend Following Discussion:
The results of The United States Investing Championship have just been published and in this section I will briefly discuss the results.
First of all, I’m not really a proponent of these type of competitions because when you get a bunch of people entering with $5,000 accounts, the winner will typically be the luckiest monkey who took the most insane risks.
If I entered with $5,000, I would throw out the window all of the risk management rules I developed over the years and take huge risks with maximum leverage. If I got lucky and won, then great, people would think I’m a trading genius and, in addition to the prize money, I could make even more selling an ebook revealing my “trading secrets”.
On the other hand, if I blew up my account, all would be forgotten and losing $5,000 wouldn’t be a big deal to me anyway.
For this reason, I think it’s much more reasonable to look at the $1 Million+ category as shown below:

So I have to give credit where credit is due. Sam Bhatia had the courage to commit a million dollars of his own money and then successfully navigated an absolutely treacherous market environment last year
Having never heard of this guy, Sam Bhatia, I did some digging and found out that he does have a Twitter account and noticed a few tweets that seemed quite sensible to me:

I’ve been saying the same thing for months: this is not a normal bull market and the best thing to do is trade small and have plenty of cash.
The dilemma, however, is what do you do with all that cash, especially during these times of high inflation? And for that we move on to the next section…
Member Q&A:
Question: Looking at USFR, monthly and 30 day SEC yields show as 2.13% and 4.31% respectively. What's the catch and potential downside? When would you exit this position?
If you’ve been reading each issue, then you know that I’ve been talking about USFR for months as a conservative way to generate an attractive monthly income.
But before I discuss the risks, I need to stress that nothing in this newsletter should be taken as investment advice. I’m only documenting what I am doing in my own account, and my investments may not be suitable for your individual needs.
To ensure there is no confusion, please complete this poll before continuing further:
Okay, so in addition to USFR I have identified four other ETFs that can generate conservative, passive income for you each month that I will delve into now.