

Weekly newsletter of Danny Merkel - Issue #93

Market Review:
Another week and another rally. The strength in the DJIA in particular is undeniable and the weekly chart below just printed its 4th white candle:

Dow Jones Industrial Average - weekly
Even though there’s one more day remaining in October, we can get a good idea of how the monthly candle for the DJIA will end up.
Month-to-date, the index is up 4,136 points, and that translates into a monthly candle that is quite formidable:
")
DJIA - monthly (2011 - present)
Now if the entire investment world consisted only of the 30 stocks in the DJIA, then I would say that there’s nothing to worry about.
Unfortunately, though, the total number of liquid stocks globally is 9,554, which means that 99.7% of the investment world is not connected with the DJIA.
So in order to get a better understanding of the health of the broader stock market, we need an ETF that contains more than just 30 stocks.
In fact, there is an ETF that contains every single investable stock in the world - all 9,554 of them - and it trades under the symbol VT.
And when we look at the stock market through this lens, the rally loses its luster:

Globally, stocks appear to be forming just another bear-market-rally that is no different from the previous meaningless bounces.
Looking at the long-term moving averages, stocks globally remain stuck in a downtrend. Even without moving averages, the pure price action has simply been forming lower-lows all year long. There is nothing about this chart that even hints of a new bull-market.
In terms of the S&P 500, one hint of new a bull market would be a break above the 200 day moving average, but that is not even close to happening yet:

I don’t personally use the 200dma in my trading system, but it’s a reasonable way to partition the market into “offensive” and “defensive” zones.
As a reminder, this is Paul Tudor Jones’ line in the sand. Whenever price is trading below the line, his focus is on playing superior defense.
Moving on the Russell 2000, it’s becoming increasingly clear that this year is turning out to be a “write off” if you’re a momentum breakout trader.
The term “chop-fest” comes to mind when I look at the chart below, or another term would be “stalemate”.

If you’re like me and you play chess, sometimes what will happen late in a game is that both players are at equal strength and the game just goes nowhere move after move. Each attack is countered by a defense and neither player can gain any ground.
Something similar is happening with the Russell 2000. Each and every rally is countered by the bears. But every decline is also countered by the bulls. The end result is that the index is stuck, there is no progress.
From a Trend Following point of view, this is exactly what you don’t want to see. Trend Followers benefit from big movement - either up or down - so it would be much more beneficial if stocks collapsed, or it would be much better if stocks ripped higher -whatever- as long as there is big movement.
Fortunately, I’ve developed rules to help reduce (but never eliminate) whipsaw trades like this. What are my rules exactly?
1) Focus on buying stuff that is making new 52-week-highs
2) Focus on shorting stuff that is making new all-time-lows
Referring back to the chart above, how many new 52-week-highs has the Russell 2000 made this year? Zero.
And how many all-time-lows has the index made this year: Zero.
In other words, the best way to Trend Follow the Russell 2000 is to simply not participate.
That’s a common characteristic good traders have with Poker players.
Often times in Poker, you are dealt a lousy hand, and you just have to fold and not play.
Think of each trading year as like a hand in Poker. Some years (such as 1995, 2005, 2013, 2017, or 2021) are fantastic, and you want to play those hands aggressively.
Other years (such as 2022, 2011, 2008) are shitty hands that you don’t want to participate in if you’re a long only momentum trader. You need to fold those hands.
To better illustrate this point, here’s a video I made showing stocks, year by year, going all the way back to 1901.
As you can see, some years trend beautifully, while other years are choppy as hell. Nothing has changed in the last 100 years.
Individual Stocks:
Beyond the utopian world of the Dow lies the dystopian world of tech. For example, Amazon continues its Stage 4 downtrend and appears totally uninvestable to me at this point:

Based on my aforementioned rules, there is no way I could justify buying Amazon here. That’s the beauty of 52-week-highs - it’s a great filter that prevents you from being entangled with money losing downtrends such as this.
Amazon wasn’t the worst performing tech stock this week though. For that, let’s turn our attention over to Facebook.
After this week’s 24% decline, META is now down 75% from the top. These are the kind of devastating declines that you need to avoid if you want to have a career as a stock trader.
It doesn’t matter how many big winners you’ve had in the past. Without risk management, a single bad trade like this can wipe it all out.
Here are 5 iron-clad rules to ensure this never happens to you:
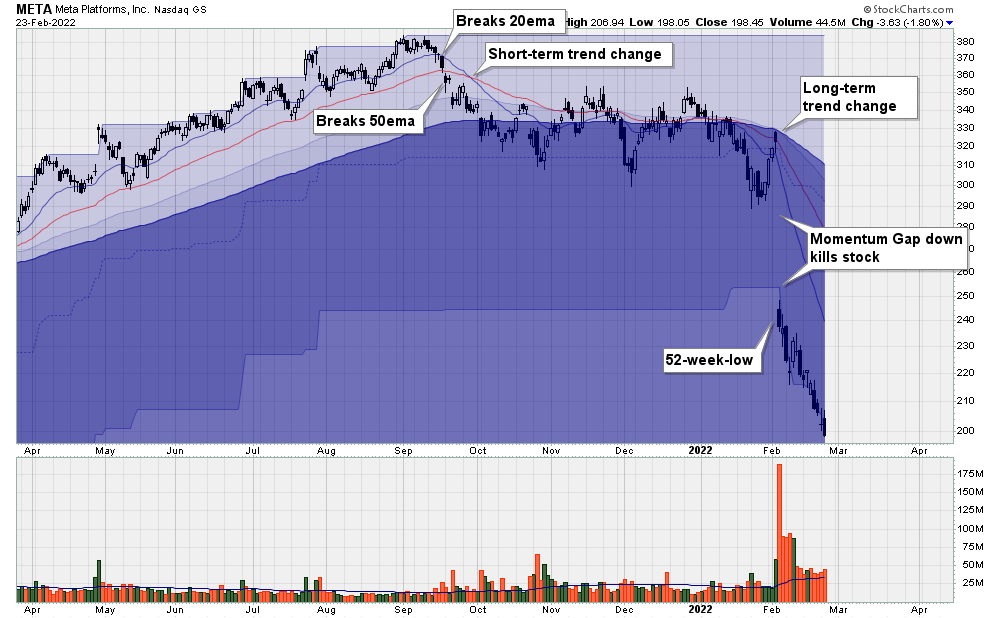
1) Price breaks the 20ema: This is a short term signal that I use for my core system. Use this rule in your own trading and it will keep you out of big losses in almost cases, barring a gap down.
2) Price breaks the 50ema: Ideal for short to medium term traders.
3) The 20ema crosses below the 50ema: A medium term signal that the short-term trend has changed.
4) New 52-week-low: By the time a new 52-week-low is reached, you should have been out of the stock long ago. If you’re still long, you’re fighting the market. If you fight the market, you will lose.
5) The 100ema crosses below the 150ema: A long-term signal that the stock has entered a full blown bear market. There is zero reason to consider buying dips or getting involved in any way on the long side.
The same pattern of destruction occurs over and over again. In a previous issue, we can see a similar story with Snap:

Remember, your number one job as a stock trader is to play superior defence. I estimate that at least 90% of traders are going broke in this tech wreck. Follow these simple rules and you’ll automatically be in the top 10%.
Trading Podcasts:
I’ve started listening to a podcast called the Meb Faber Show and lately this guy has really been on a roll with some great guests.
A few weeks ago, poker professional Annie Duke was interviewed. A lot of Trend Following parallels in there. For example, amateurs play their hands way too often. Professional players fold at least half the time. The same applies to trading.
More recently, Salem Abraham and Jerry Parker were interviewed:

Jerry Parker & Salem Abraham - Lessons From A Lifetime of Trading
Current Holdings:
Here are my holdings going into next week:
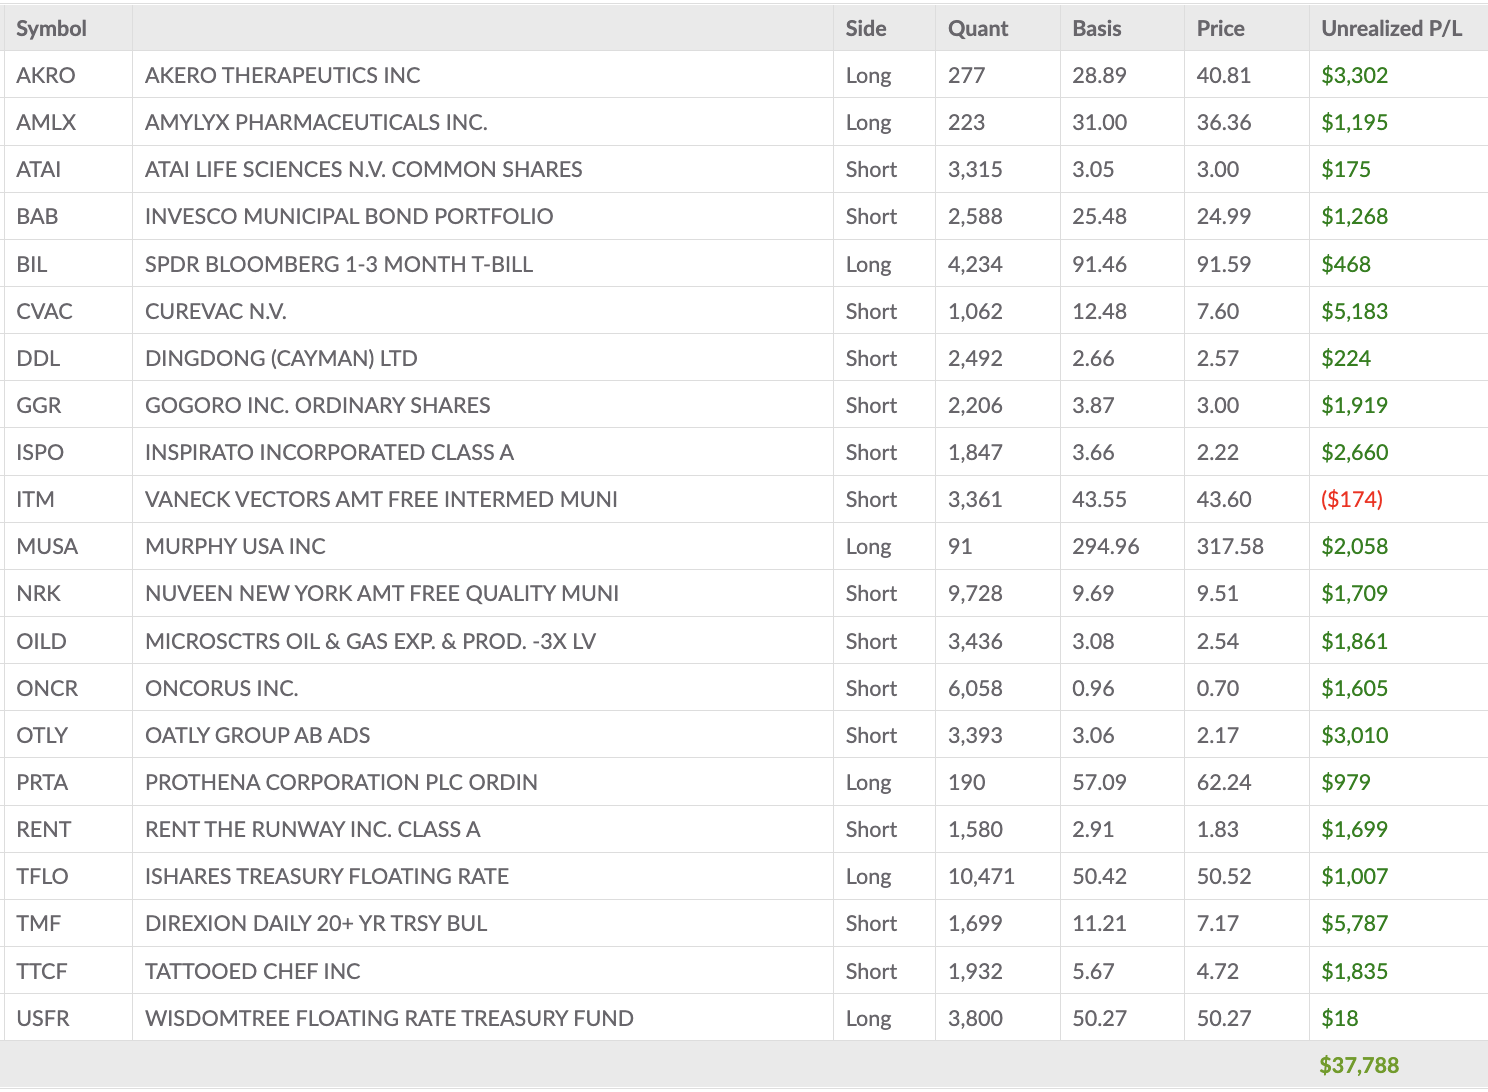
Given that I’m still net short and given that the market has risen over 4,000 points this month, I’m not exactly thrilled, but I’m also weirdly not getting killed either; just barely hanging on to a gain for the month:

My newest trade was a short in DDL:

A never do any fundamental analysis on the stocks I trade, but with a name like “DingDong Ltd” I would guess that it’s a Chinese company. Or they produce doorbells. Hard to say for sure.
More importantly, the stock has gapped down to a new all time low. I’ll be holding this small position until price closes above the 20ema (thin blue line).
In terms of long ideas, Energy is still strong. A new long idea in this area is