Weekly newsletter of Danny Merkel - Issue #91
Market Review:
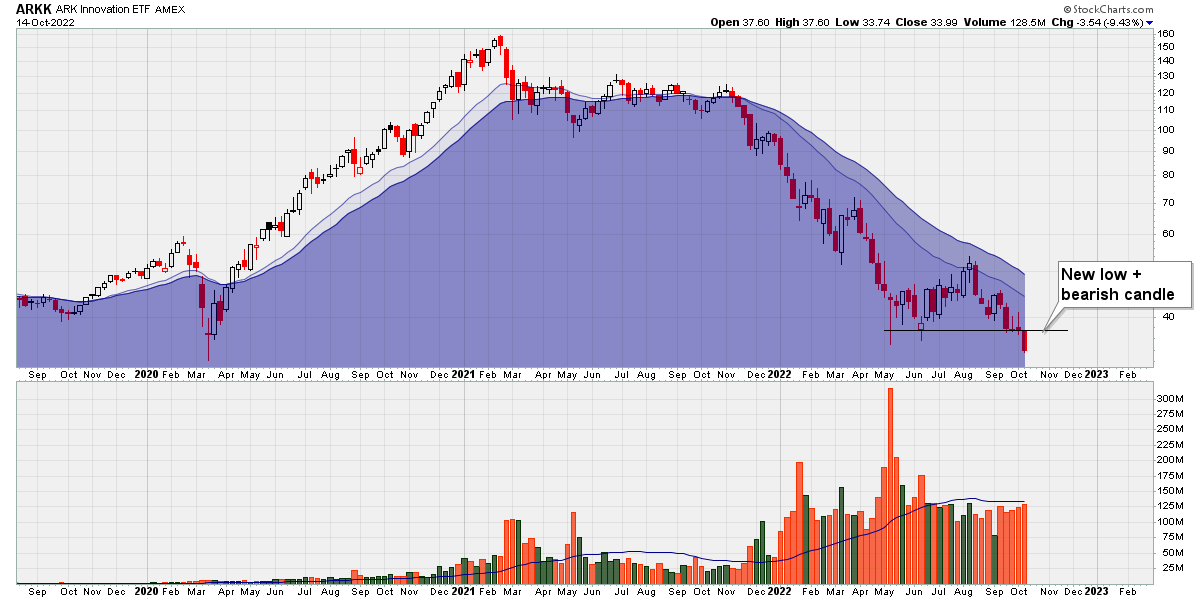
An especially chaotic and wacky week in the market. On the one hand, growth stocks continue to get pounded, with the ARK Innovation ETF down another 9.43% for the week:
With a big red candle ushering in a new 52-week-low, there is absolutely no reason to even consider getting involved on the long side.
Once you’ve developed a Trend Following mindset, you simply lose interest in trying to catch bottoms. Not only is it unnecessary, it’s extremely difficult to do so and - even if you get lucky and manage to pull it off - you still may not make money.
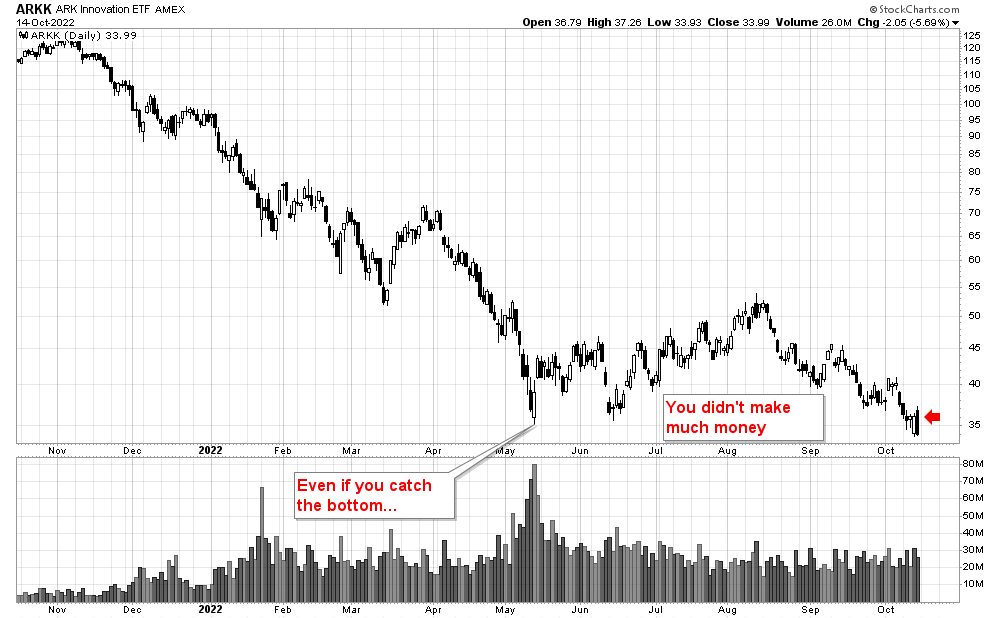
For example, let’s say by some miracle you nailed the exact low in ARKK back in May. From there, price never really took off and today is back to a new 52-week-low:
So this whole trade might have been great for your ego and it probably would have made you feel pretty smart, but you didn’t actually make any money.
In other words, catching market bottoms requires a kind of compound prediction:
1) You need the market to stop going down
2) You then need the market to actually start going up
What a lot of these dip-buyers in growth stocks and also crypto fail to understand is that their beloved new buy might end up going sideways for 10 years. Most of these former leaders will likely never see another all-time-high again in my lifetime.
On the other hand, though, there were some signs of strength outside the world of growth stocks.
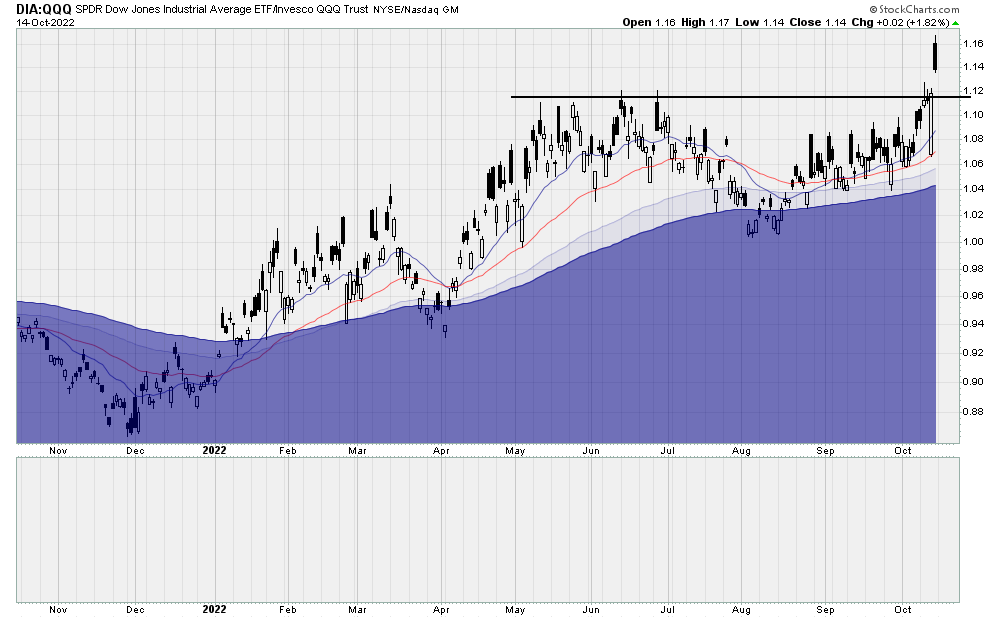
The rather old-fashioned DJIA was the best performing index. Unlike ARRK, it actually rose for the week, and this strength is taking place at a logical double-gap-support area:
In this unbelievably tricky market, in order to make money, one needs to think outside of the box. Simply buying a bunch of growth stocks and hoping they’ll go up isn’t working. Sure, it worked great it 1985 or 1995 but in the idiocracy we live in today, it’s been a disaster.
So given that tech stocks have been so weak and given that the DJIA is holding up, you can create a long/short pair trade.
For example, if you bought, say $10,000 worth of DIA and shorted the same amount of QQQ, you’d end up with a chart that looks like this:
Long DJIA + short Nasdaq
This combo trade has been in an uptrend for most of this year and offers some unique advantages over being 100% long only.
Firstly, the pair trade is market neutral, meaning you can potentially make money in a bull or bear market.
Secondly, because DIA pays a high monthly dividend and QQQ hardly pays a dividend at all, the pair trade puts money in your pocket each month.
Remember that a core principle of Trend Following is being just as willing to go long as to go short. Look at the portfolio of any trend following system, and you’ll see longs + shorts covering many different markets.
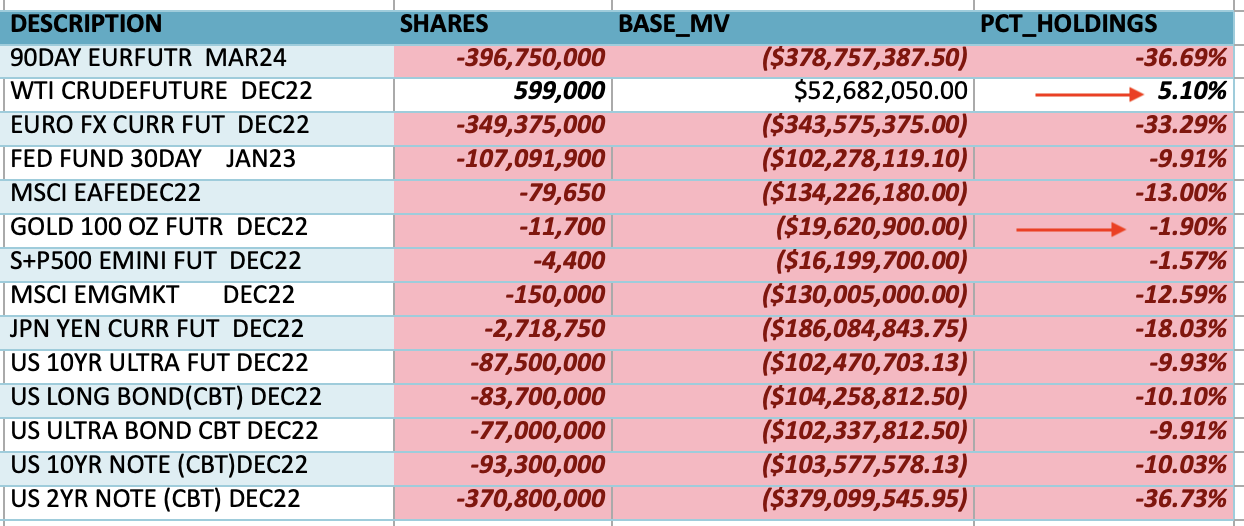
A new great way to monitor an example of a trend-following system is to keep an eye on the holdings of DBMF, which takes a robust and complete trading system and wraps it up into an easy-t0-trade ETF.
Current holdings of DBMF
Although the portfolio is always shifting day-by-day, we can see at this moment the strategy is long crude oil. It’s also short a variety of other markets including, for example, Gold.
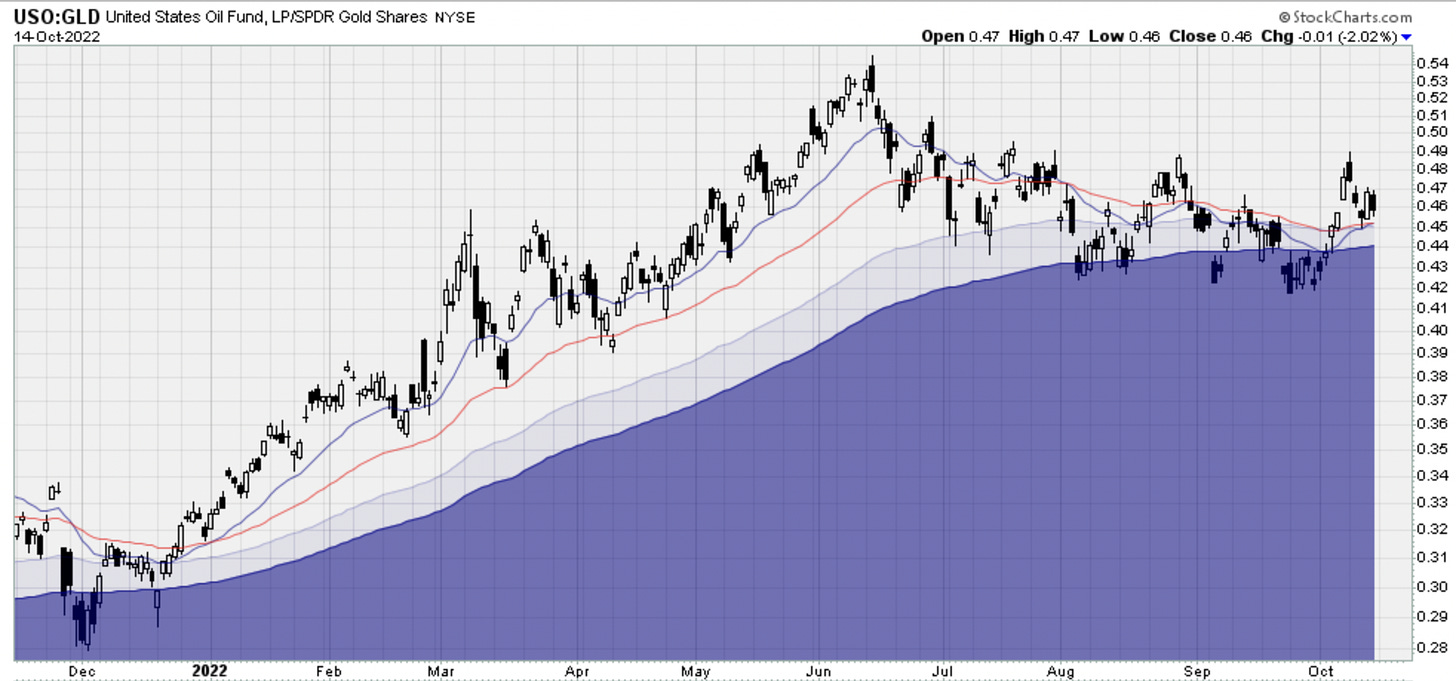
And so this combination is another pair trade, which can be charted by taking USO (an ETF that tracks crude oil) and dividing it into GLD:
Long crude oil + short gold
With this pair trade, you’re not really bullish or bearish on commodities. You’re no longer hoping and praying for the stock market to rise, since it won’t make a difference.
Even if the stock market crashes (or if it rips higher) it just doesn’t matter. Being long + short makes you much more robust; it makes your portfolio very difficult to kill.
Individual Stocks:
As mentioned last week, TSLA has been catching my attention lately.
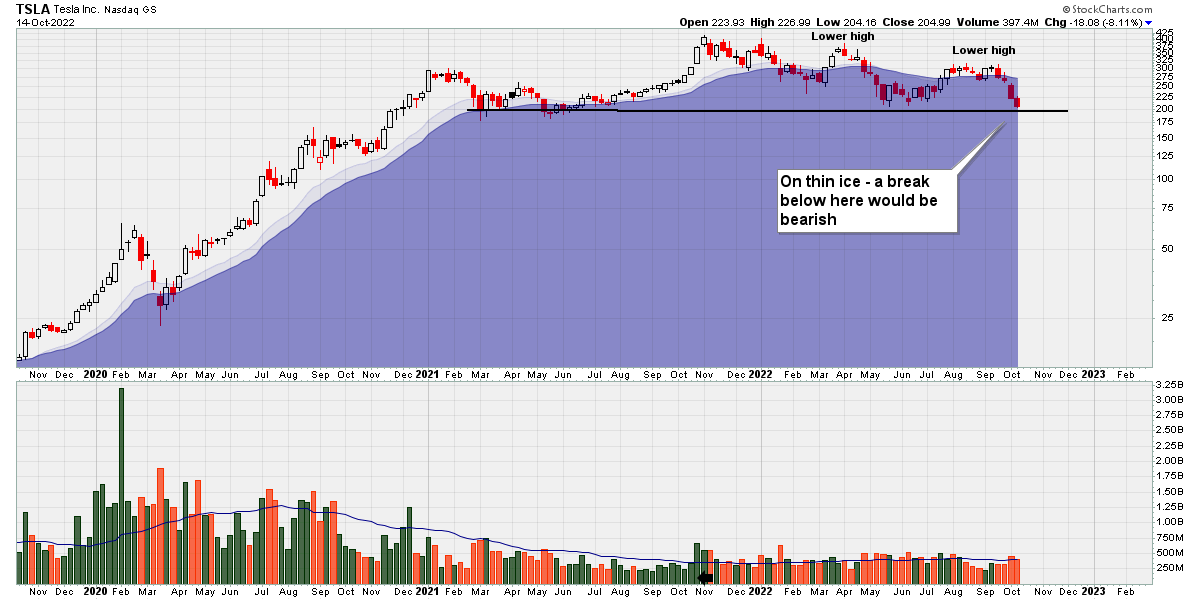
To be more specific, the stock has been basing for almost 2 years, which may superficially appear bullish, but my view is that if TSLA was going higher, it would have broken out already.
Just like with AMZN months ago, a base that is excessively lengthy indicates distribution. Another sign of distribution is the series of lower highs.
If price breaks the horizontal line, then that would create a new lower low:
TSLA weekly chart (2019 - present)
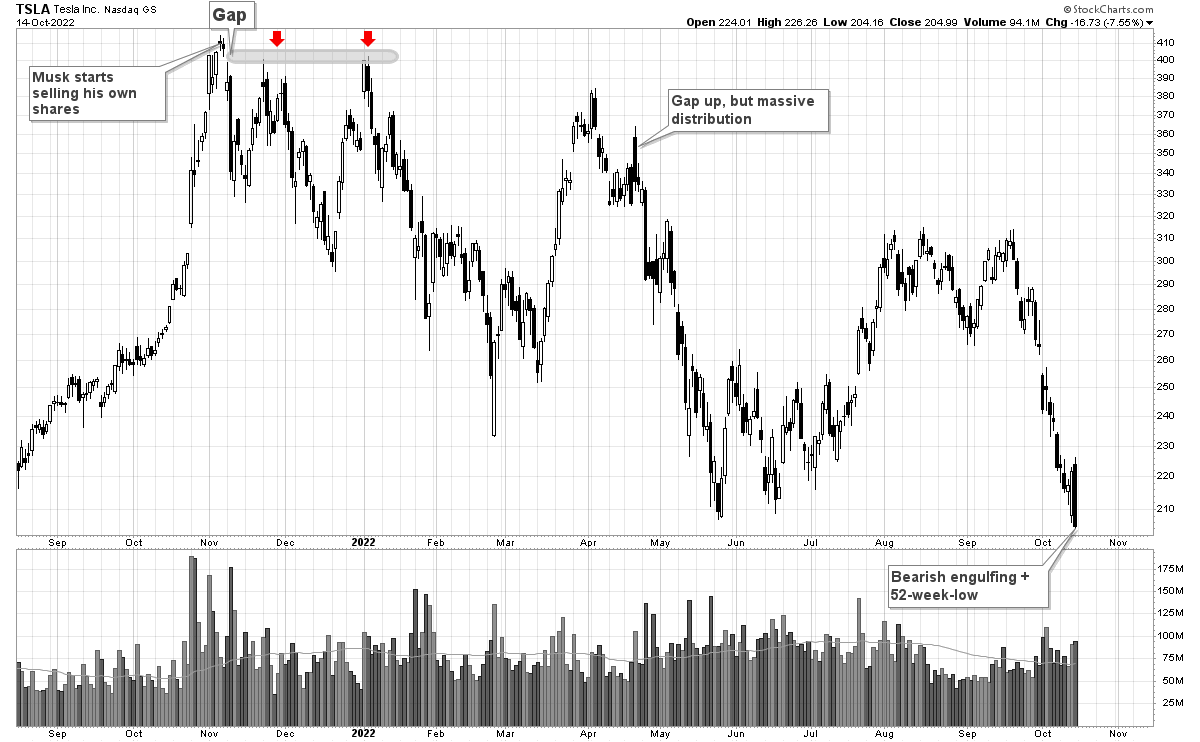
Moving on to the daily chart, one important observation is that price hasn’t made new high since November 2021, back when Musk started dumping his own shares. Even though fundamental analysis is definitely not my forte, this should have been a major red flag.
But even with zero knowledge of this fact, the chart alone shows that price gapped down on this news and - importantly - never recovered, failing twice at gap resistance (double red arrows):
Subsequently, there were plenty of signs of distribution, such as the gap up and instant fade in mid-April. In my opinion, this was a clear sign that big institutional money was not getting involved.
Moving forward to today, notice how price put in a bearish engulfing pattern. While a single day’s candle is mostly noise, this price action is also occurring within the context of a new 52-week-low.
If you want to be a trend following trader, you absolutely do not want to be holding stuff making new 52-week-lows; if you are, then it means you are fighting the market.
Never fight the market. You will lose.
Interesting ETFs:
It has been my opinion for a while that the current market environment is not conducive to long only trading, and this week’s price action really drove home that point.
In particular, the price action on Thursday and Friday shows, at least to me, how profoundly “broken” the market has become. With the market swinging close to 2,000 points - from sheer panic selling to manic short-covering - in a few hours, I recognize that I have no edge.
And so with no trading edge, the best thing a trader can do is walk away (at least for now). Until conditions improve, I’m personally investing all of my idle cash into
