

Weekly newsletter of Danny Merkel - Issue #85

Market Review:
If I were to sum up this week’s price action into a single word, it would be “distribution”.
The weekly chart of the NYSE has distribution written all over it. To be more specific, notice the series of lower highs on the index over the past year:

This topping pattern is so hideous that I now think it has the potential to break down and, eventually, re-test the lows of the COVID crash.
")
QQEW Index - weekly (2018 - present)
I touched on the Nasdaq Equal Weighted Index in the previous issue, and this week we had another bearish candle on volume that is double the average.
I know that a lot of traders out there thought this rally was the start of a new bull market. The folks at IBD, once again, declared a new “confirmed uptrend”, although that supposed uptrend is now “under pressure”.
My perspective is quite different: growth stocks are in a full-blown, hardcore, bear market.
I simply define a bear market when the 100 & 150 moving averages cross over, and for the IBD 50 index that occurred near the start of the year (dashed vertical line).

From there, each rally has been nothing more than a dead cat bounce. Even the most recent rally did little to reverse this relentless downward momentum.
I have a tremendous amount of respect for IBD’s founder, William O'Neil and his great book How to Make Money in Stocks. I would have loved to have read that book when it first came out in 1988 while riding huge winners in the great bull market of the 80’s and 90’s.
But the market environment today couldn’t be more different. The 80’s and 90’s saw a robust bull market with real technological innovations and improvements in standards of living.
For those who disagree, it might be time to ask some hard questions.
Why is it that every growth stock breakout fails?
Why does every rally in every index peter out?
Why is it that so many stock traders are down 75% year-to-date?
Would that be the case in a healthy market?
Moving on, I continue to view the VIX index as “coiled”. Notice the series of higher lows - pressure is building:
")
VIX - weekly (2018 - present)
After 10 black candles in a row, the VIX finally did indeed erupt higher, creating a gap up. This is likely to be only the first tremor and a harbinger of a much bigger eruption to come.
Individual Stocks:
The sector that got slammed the hardest this week was semi-conductors.
A canary in the coal mine for that industry was that the Taiwan iShares (EWT) has been leading the way down.
Laden with semi-conductor names, EWT continues to form a monstrous rounding top formation:

The phoney short-covering rally only served to form a bearish continuation pattern within the context of a bear market.
Drilling down to individual names, it was Nvidia that was taken out to the woodshed this time, losing over 16% for the week.
With a drawdown now of 62%, NVDA is a stock you absolutely would have wanted to avoid this year and here is a simple of rule of thumb that can help you do just that.
Before buying a stock, ask yourself an easy question: has price made a new 52-week-high this month?
The neat thing about a question like this is that it’s objective. It doesn’t matter if you’re a day-trader, a fundamental investor or a Trend Follower - the answer (either yes or no) is the same for all.
Now by asking this question for a stock like NVDA, we can segment the chart into “Yes” and “No” zones:
")
NVDA with 52-week-high channel (blue zone)
Notice that if the answer is “Yes”, it indicates that the bulls are in control and it’s probably not a bad idea to get on board.
Conversely, when the answer is “No”, it shows that the bulls have lost control and you’d want to avoid the stock.
Because NVDA hasn’t made even a single new 52-week-high this year, I have quite simple avoided the stock for all of 2022.
Besides Nvidia, there are plenty of other growth stocks that look problematic.
For instance, a company called Lightspeed (formerly known as Lightspeed POS) is breaking down from a bearish continuation pattern
")
LSPD - weekly (2019 - present)
Similarly, Shopify is threatening a breakdown below $30, which has been a major level of support for the stock up until now.
Since the stock is already down 83% from its high, many traders will believe that surely the bottom must be near. Yet, as William O'Neil once said, one of the greatest paradoxes of the stock market is that what seems “too low” often goes even lower.
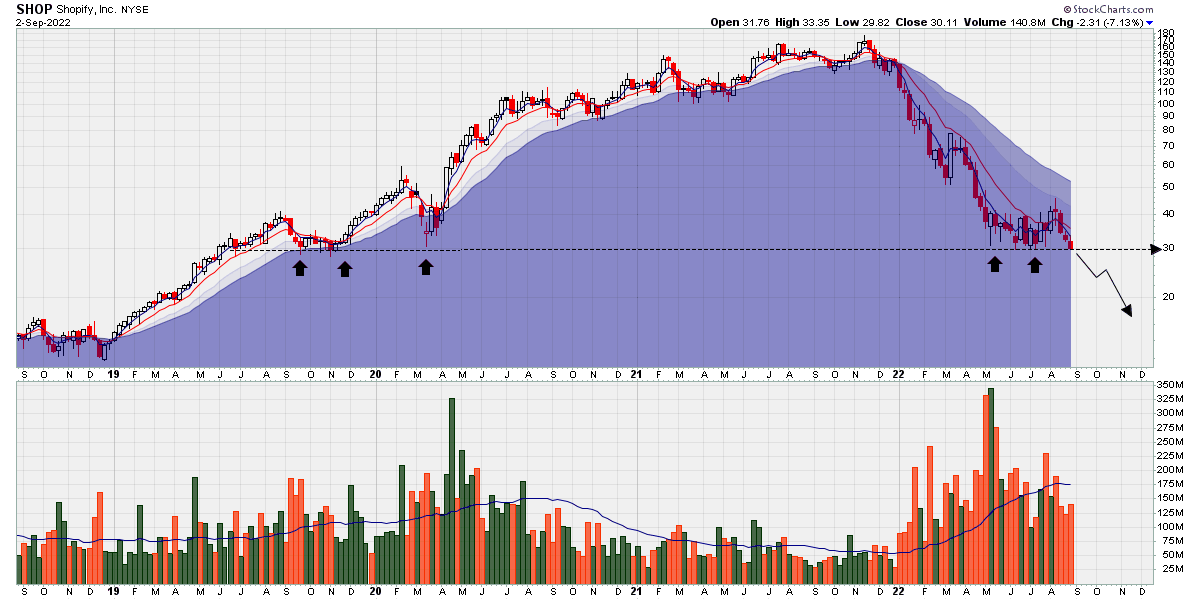
In the case of SHOP, a break below $30 could easily lead to a quick drop to at least the $15 - $20 area.
Interesting ETFs:
As promised, let’s delve deep into this exciting new ETF that follows a classical Trend Following approach.