

Weekly newsletter of Danny Merkel - Issue #88

Market Review:
Another week of massive pain for the bulls. The DJIA shed another 1,232 points for the week and that puts it within striking distance of a major gap fill:

The previous gap up in November 2020 (due to COVID vaccine related news) could act as short-term support but, to be clear, that is not a buy signal for me.
I’m a Trend-Following trader, not a dip buyer, which means that I never buy on weakness. However, if I was forced to buy a dip in the market, now wouldn’t be the time. If pressed to buy stocks at a discount, I would be patient and wait until the market reaches its 200-month-moving-average.
As I explained in more detail in issue #74, the 200 month moving average has acted as major long-term support in a variety of asset classes over time.
Now if we look at the Nasdaq from this long-term perspective, we can see that there’s still a long way down. At the moment, the 200 month line (blue zone) is just under 7,000; but because it is gradually rising, one scenario would be that it intersects with price in a few years at higher level:
")
Nasdaq with 200 month moving average (1995 - present)
This chart, admittedly, is subjective. But the point is that if you study market history, there is potentially a lot more downside than the typical dip-buyer nowadays is prepared for.
The term “buy the dip” has grown in popularity over the years and this next chart may explain why.
In the top panel, we have the S&P 500 going back to the year 1999. Beneath that shows the number of days the market traded below the 200 day moving average:
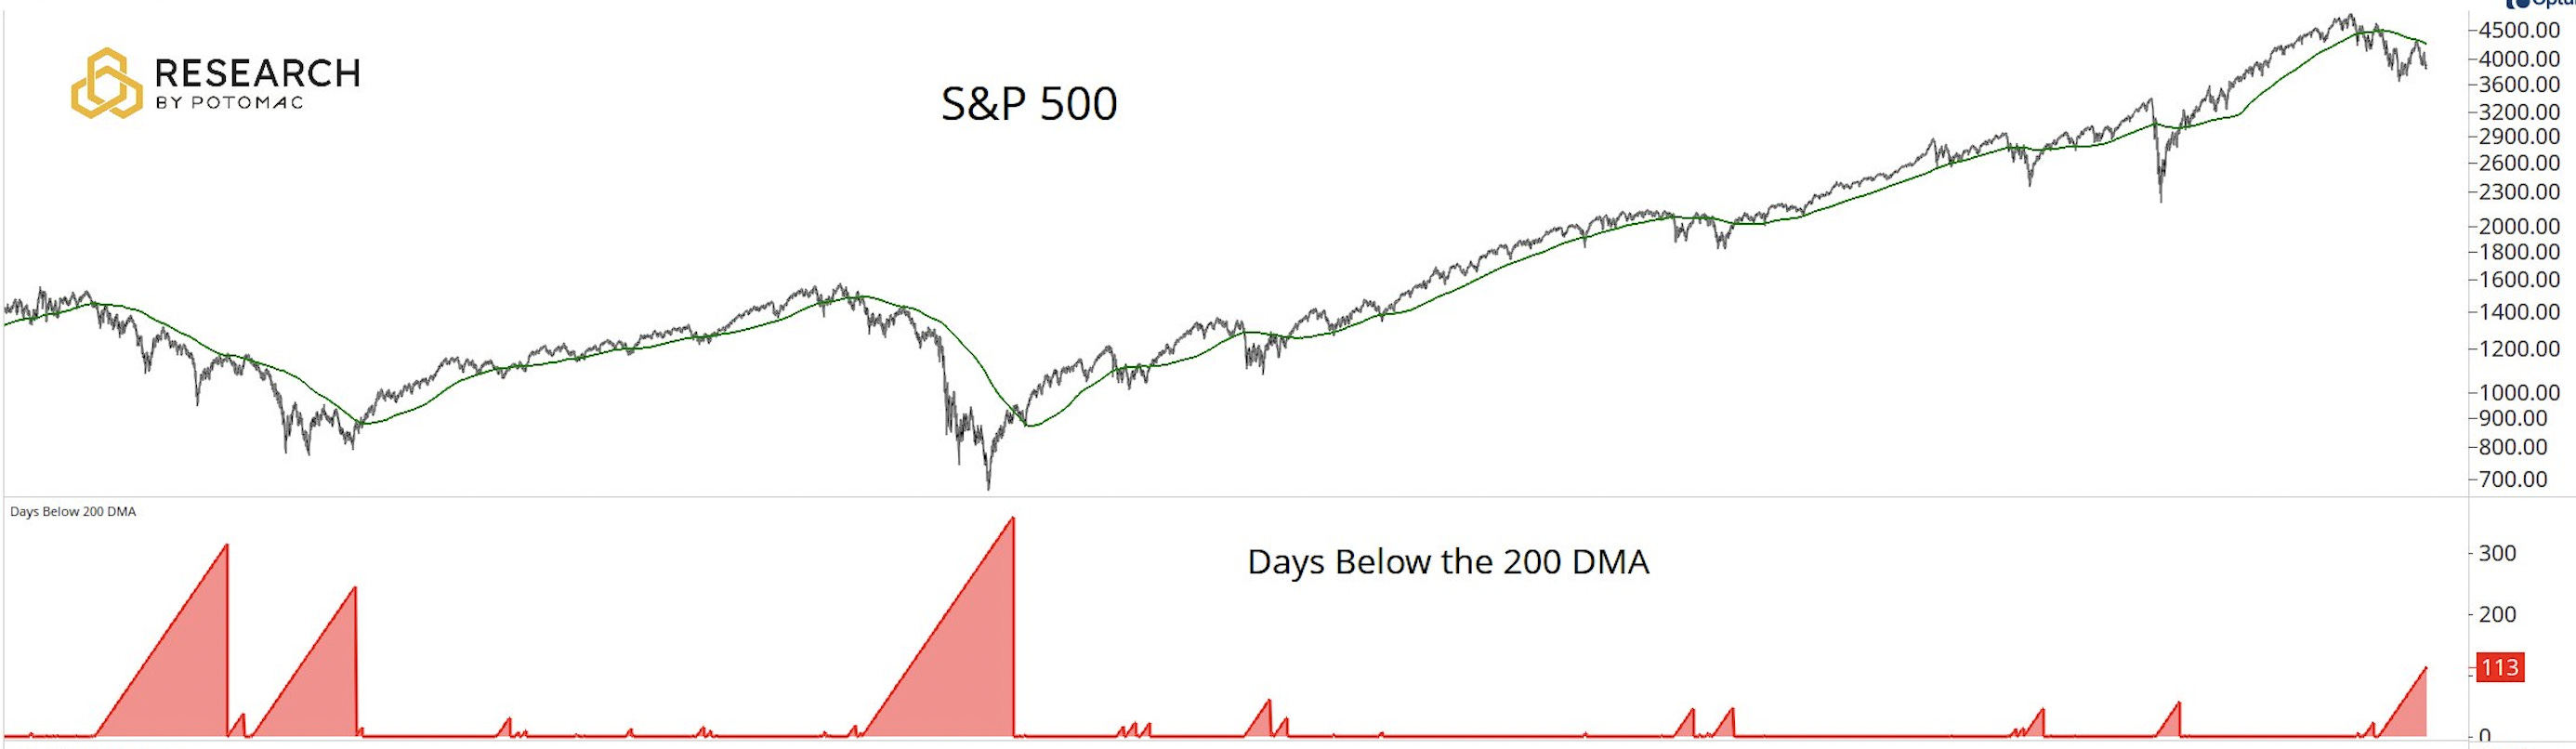
As the number of days below the 200dma increases, the area in the bottom panel grows taller and taller.
Now what this unique chart illustrates is that beyond 2008, each every dip below the 200dma was short-lived. Over and over again, each dip was quickly recovered, lulling young traders into a state of complacency.
Also, notice how the S&P 500 today has spent more time underneath its 200ma since the GFC back in 2008. In my opinion, this is not your garden variety pull-back, but something much more serious.
Last week, I discussed how a 200 & 250 moving average pair could be used to partition the market into bullish and bearish “super-cycles”.
In the chart below we have the 200dma in light blue and the 250dma in dark blue. From this perspective, the two lines always appear tantalizingly close to each other but, paradoxically, almost never do actually cross, except for special times such as right now:

SPY with 200 & 250ma crossover
The bottom panel shows the difference between the two moving averages. Given that there hasn’t been a crossover since 2008, it obviously takes a lot to get this pendulum swinging the other way and, in fact, even the COVID crash wasn’t enough to move the needle.
But for the first time in 14 years, the super-cycle has changed to down. This could explain why the aforementioned dip-buying simply isn’t working anymore. Dip-buying works in a bull market, but that’s over now.
Because dip-buying isn’t working, I’m starting to see a lot of growth stock gurus trying to re-invent themselves as “sentiment experts” now.
Go on social media today and I’m sure you’ll see all sorts of tweets about put option buying being at extremes, which is supposed to be some kind of bullish contrarian signal.
While it is indeed true that a lot of put options were bought on Friday, that is not necessarily good news. Let’s go back in time to the previous bearish super-cycle - 2008 - and look at the put/call ratio at that time.
Starting from the left side of the chart below, there was a big spike in put buying in June of 2008, but the trend of the S&P 500 kept grinding lower, so that was a swing and a miss.
Moving on to the autumn of 2008, things really started getting hot and heavy. There were two more spikes in put buying, yet the market continued to plunge. Another swing and a miss.
Then in November of 2008, a surge in put buying did lead to a weak bounce, so partial credit goes to the sentiment experts there.
")
S&P 500 with Put/Call ratio (2008 - 2009)
By the time the market did put in its ultimate low (in March 2009), there was surprisingly little put buying.
The bottomline is that this sort of analysis might be good for generating a lot of retweets on Twitter, but does nothing in terms of generating profits in your trading account.
Interesting ETFs:
All this talk about put options got me thinking of an interesting ETF. Trading under the symbol PUTW, this fund’s sole mission in life is to write (short-sell) put options on the S&P 500.
By charting the progress of this ETF, we can get a glimpse into the world of the put seller. For instance, during bull markets, such as in 2019, life is pretty good and you make steady money.
However, writing puts if often compared to picking up nickels in front of a steam roller and when the COVID crash hit, put writers got steam-rolled really hard:
")
PUTW - weekly chart (2018 - present)
From March 2020, the put-writers managed to scrape themselves off the asphalt and resume their quest for more nickels. Quite a few nickels were picked up in 2021, but things are starting to look dicey more recently.
The ETF just printed a new 52-week-low on Friday, which completes a bearish head & shoulders top formation. In other words, it looks extremely vulnerable to further losses and if we ever see a disorderly market decline, this ETF has the potential to deliver extraordinary pain.
The astute trader may look at this ETF and see a short-selling opportunity. If I had a large, long-only retirement account (which I don’t), then I would consider a PUTW short as a possible way to hedge downside risk.
Another way to hedge a stock market decline is through adding Trend Following to your portfolio. An interesting feature with following trends (both long and short) in a wide variety of different markets is that it tends to have close to zero correlation with the stock market.
As it stands right now Trend Followers are doing well during this crazy time in market and the ETF we discussed - DBMF - just hit an all-time-high on Friday:

With my core strategy I buy ETFs that are making new highs, so there is no reason for me not to own DBMF.
Other than DBMF, the only other ETFs that are making new highs involve short-term treasuries.
Two weeks ago (see issue #86), I profiled several conservative ETFs that can allow one to earn passive monthly income. One such fund is SGOV and, as the chart below shows, it’s been on a tear recently:

The chart above may look “over-extended”, but when it comes to short-term treasuries, you just need to forget about concepts such as this. Don’t think of the chart in terms of being overbought.
The key point is that once a move gets going, it tends to keep on going, just as another fund - BIL - did back in 2019.
")
BIL short-term treasure ETF (2019 - 2020)
Granted, you’re never going to get rich holding ETFs like this, but they are a great way to preserve capital, earn a monthly income and wait it out until better opportunities arise in the future.
Current Holdings:
Here are my holdings going into next week: