

Weekly newsletter of Danny Merkel - Issue #83

Market Review:
During the past few weeks, we experienced one of the most intense short-squeezes in years, but the evidence appears to me that it’s over.
Without panic short-covering and without institutional money stepping in, there is really no one left to buy and so the market dropped like a stone on Friday.
The ARK Innovation ETF, shown below, had previously been forming a questionable, upward slopping base, but that just broke down with a gap below support.

Zooming out to the weekly chart, we can see that thanks to manic short-covering, ARKK did manage a few weeks of outperformance.
However, this week’s sharp reversal and formidable black candle completes a bearish continuation pattern.
")
ARKK versus MTUM - weekly (2018 - present)
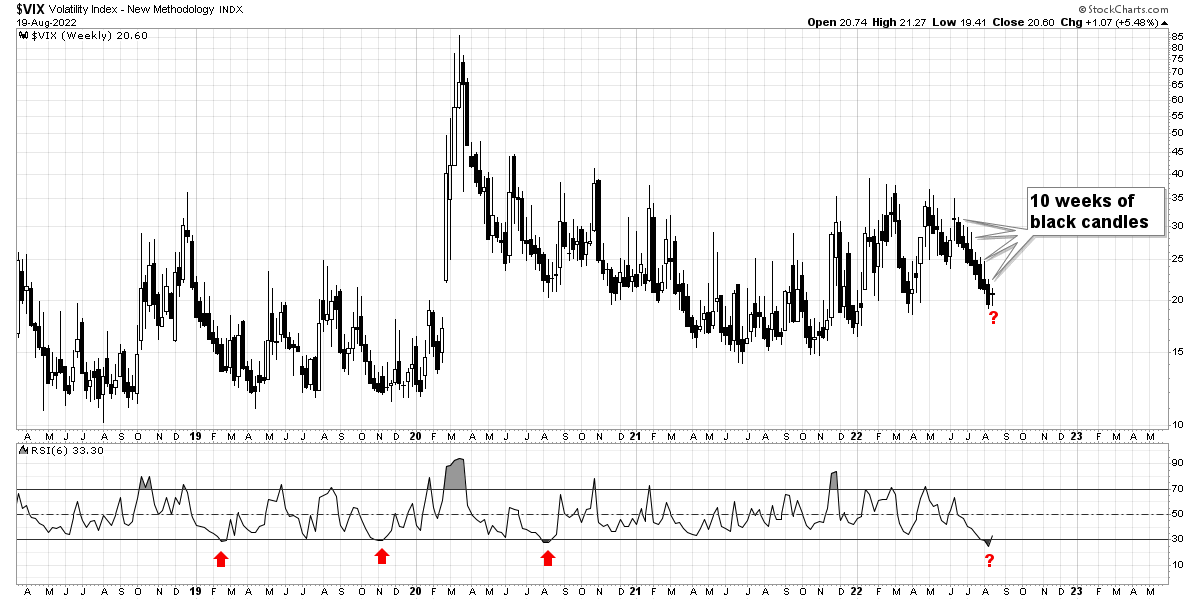
Moving on, the VIX continues to coil. In a previous issue, I mentioned that the VIX had experienced 7 black weekly candles and, fast-forwarding to today, we’re at 10 black weekly candles in a row.
In addition, the weekly RSI of the VIX has just registered its most oversold RSI reading in a decade. Although I’m not a fan of the RSI indicator (as discussed last week), for a mean-reverting index such as the VIX, it has a pretty good track record.
Like a long-dormant volcano, the VIX now has the potential to erupt at any time.
Another clue that this is merely a bear market rally is that the S&P 500 has been living under its 200 day moving average for the entire bounce.
A very simple rule of thumb that professional traders - such as Paul Tudor Jones - use is to focus on playing superior defence when the market is trading below its 200dma.
For example, during the bear market of 2008, the S&P 500 didn’t trade above its 200dma even for a single day.
")
S&P 500 with 200dma (2006 - 2009)
The fact that the market is trading below the 200dma at this moment doesn’t mean we’ll have a repeat of 2008, but it is a clear sign to me that it’s time to focus on defence.
Individual Stocks:
The price action this week of many leading stocks appears worrying, in my opinion.
For instance, Amazon originally formed a suspiciously long 21-month-base, which no doubt frustrated a lot of traders who misinterpreted this as accumulation.
")
AMZN weekly chart - (2019 - present)
From there, the base broke down, attracting short-sellers, who then got caught up in this most recent squeeze.
This squeeze, however, only brought price back to resistance. Based on this, it is likely a poor area to deploy new money into a stock like AMZN. But because I trade with rules, it doesn’t really matter what I think.
My rules are clear in that I buy new 52-week-highs, and that’s not happening in the chart above, so I’m not buying for that reason alone.
In terms of shorting, my main focus is to short all-time-lows, so you might as well forgot about shorting Amazon - that’s almost certainly never going to happen.
The bottom line is that trading Amazon has been really tough over the past 2 years. Maybe if you’re a day-trader (whatever that means) you could make money, but I’m not that smart, so the next best thing is to just avoid it, which is what my rules have been telling me to do all along.
Next, let’s have a look at Apple. First of all, I completely missed this insane rally that started in mid-June but, then again, if I was good at picking market bottoms, I wouldn’t be a trend follower.
I genuinely have no regret about missing this rally, as I trade with rules, and AAPL never met my criteria. To be more specific, this entire rally produced exactly zero 52-week-highs, so logically it also produced zero buy signals for me.
One interesting take away, though, is to always be aware of gap downs, since they will often act as resistance later on.
")
In this case, Apple perfectly filled its previous gap down then, like clockwork, turn on a dime and started heading lower. Buying into this FOMO induced rally at a gap resistance zone was a very poor risk/reward proposition.
Bitcoin:
Just as I suspect that the rally in stocks is a bear market bounce, the evidence also points to the same with Bitcoin.
After breaking down from a 15-month base (stage 3), Bitcoin broke support, which started a Stage 4 decline. From there, price rallied but was contained within a dubious bearish pennant.
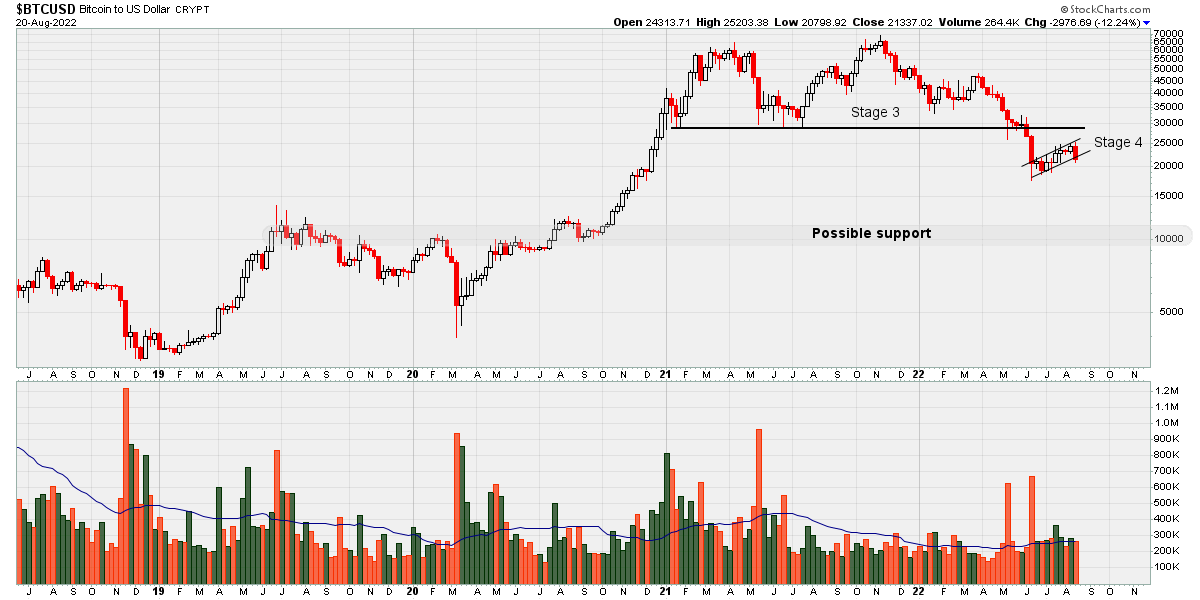
If price breaks down from this bearish continuation pattern, then I don’t see any logical support for Bitcoin until the price point of around $10,000.
Commodities:
At the start of the year, I outlined a hypothesis that gold could be the best trade of the year. Fast-forward to today, and it turns out that I was totally wrong.
However, let’s review how a rules-based approach dealt with being so completely wrong.
For reasons that I’ve explained before and won’t explain again, my preferred method of taking advantage of commodities is to short-sell the inverse ETF.
In the case of getting exposure to gold stocks, I sold DUST short when it printed a new 52-week-low early last March:
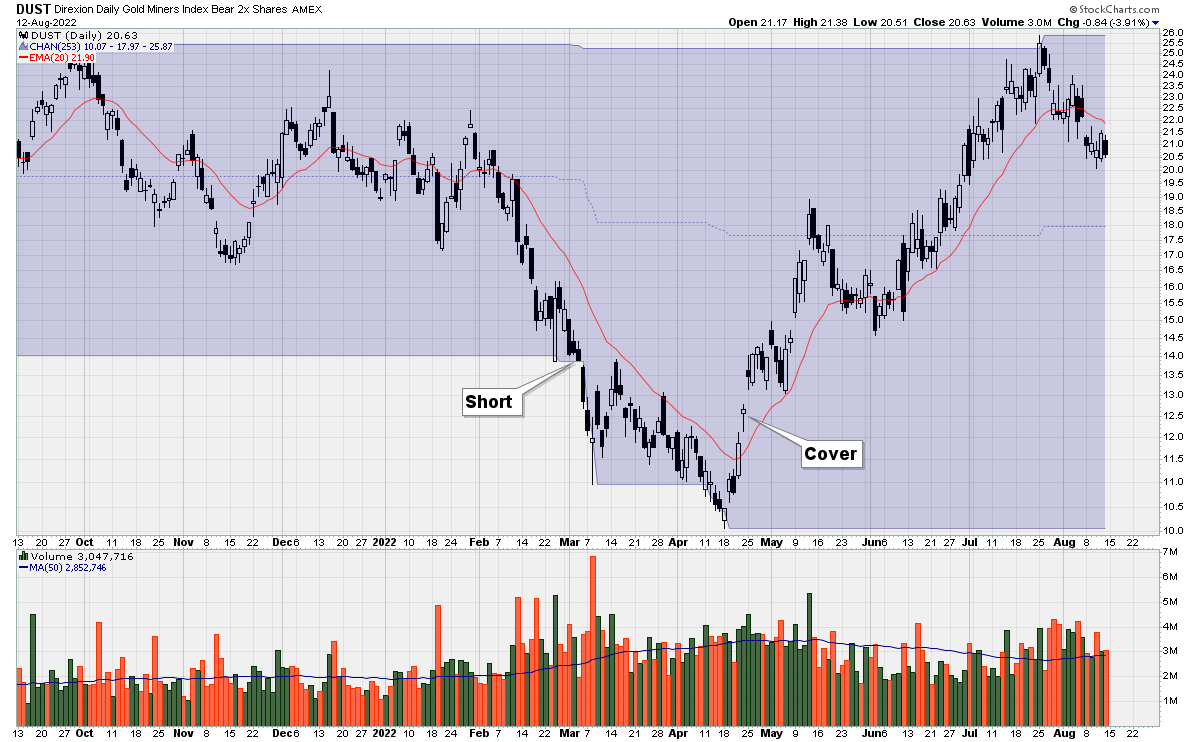
From that point, my rules for exiting are very clear: hold until price breaks the 20ema then cover the following trading day. Referring to the chart above, I covered in mid-April.
And that was it. I tried the trade, it wasn’t working for me, and so I followed my rules and exited. The trade just disappeared from my portfolio and I forgot it quickly.
Also, because I followed my entry, position sizing and exit rules, I do not consider this trade to be a “mistake”. Given the information I had available at the time, I’d do this trade again. It was a good trade that happened to lose money.
I would say that 99% of traders don’t really get this point. For them, every loss is a mistake, something they should learn from. On the other hand, for me, there is nothing to learn - it’s just one trade and the outcome of one trade is mostly random. It’s like playing a single hand of Poker - you can play your cards perfectly and still lose.
So if there’s not much to learn from a single losing trade, what should you do? The answer is suck it up and move on to the next trade!
And speaking of the next trade, the strongest commodity in the world right now is Natural Gas, so that is where my focus is.
Breaking out of a 12 year base, the long-term monthly chart continues to appear constructive.
")
Since Natural Gas is printing new 52-week-highs, it is something that I want exposure to.
But if you have a stock brokerage account, you may be unable to trade futures contracts, which means that you’re left with the option of trading ETFs.
Now there is an ETF that tracks the price of Natural Gas - UNG - but it does a lousy job of tracking the actual commodity price and tends to erode in value over time.
Therefore, just like with my gold stocks idea, my method of choice is to short the inverse fund - KOLD.

Back on February 5th, the price of KOLD was printing new 52-week-lows and since then the ETF has collapsed in value by over 90%.
Given such a precipitous decline, it may seem reasonable to believe that the move is over, but one thing to keep in mind with these leveraged ETFs is that they’ll go down 90% over and over and over again.
Thanks to reverse splits, the ETF becomes a bottomless pit, a pit that traps a lot of new traders who really don’t understand this fact.
But there is no guarantee that the trend will continue, and one always needs to respect risk. It’s worth pointing out that Natural Gas is extremely volatile. And this ETF takes this extremely volatile commodity and leverages that.
For this reason, it’s really important to position size based on volatility. If a new trader simple invests a fixed fraction, such as 10% of one’s portfolio, then forget it, don’t even bother shorting something like this.
Shorting selling KOLD isn’t going to appeal to a lot of traders, I realize that, so let’s try something more conventional.
Last week, I discussed Occidental Petroleum as an example of what real institutional buying looks like. Then on Friday, we got another big dose of that.
By chance I glanced over a news headline mentioning that Warren Buffett is in the process of buying a huge stake in the company, but even if you didn’t know that, the chart below makes it clear that there’s a big buyer stepping in:

Current Holdings:
Here are my holdings going into next week:

Disclaimer: not advice to transact in any security
As has been the case for a while now, I simply cannot make money buying stocks in this market. And as I touched on last week, ENPH had every opportunity to rally, yet didn’t.
After holding the stock for 3 weeks, I’m up $39 on the trade - that’s not a good sign. Likewise, another recent buy - SRTS - fell apart badly as well.
Except for a few pockets in the energy sector, institutional buying is completely absent in this market. That’s also why there are literally zero equity ETFs making new highs as well.
The evidence points to this rally being fuelled by short covering, and that is evidenced by the lowest quality names - such as BBBY, AMC and GME - rallying the hardest.
If the shorts have been squeezed out and if the institutions aren’t going to step in, then who’s left to buy?