

Weekly newsletter of Danny Merkel - Issue #87

Market Review:
Stocks got slammed and the weekly charts of all the indices appear vulnerable to further attacks by the bears.
The Nasdaq Equal Weighted Index just put in a bearish engulfing pattern on the weekly chart, meaning that this week’s candle completely envelops the prior candle:
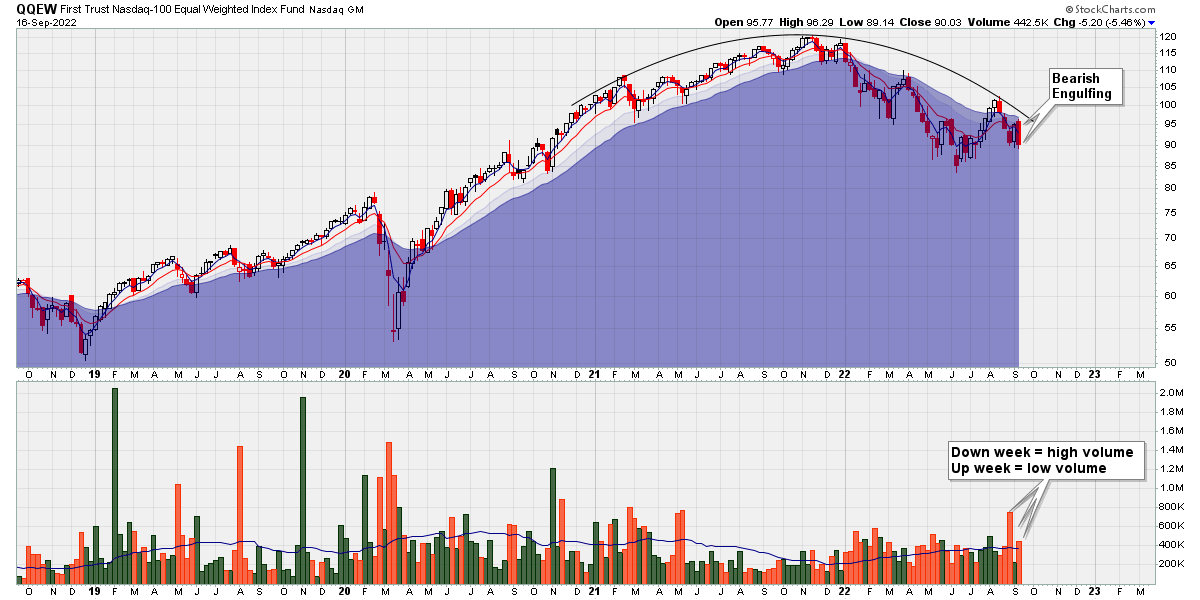
Although a single candle doesn’t establish a trend, the fact is the trend was already down, so we have a bearish pattern within the context of an already established bear market.
Notice, also, the volume pattern recently. Big volume on down weeks and light volume on up weeks spells only one thing: distribution.
A slightly different perspective comes from looking at the so-called FANG stocks. Even though there is no official “FANG” index, there is an ETF that does track these names that trades under the symbol FNGU.
For most of 2021, this small handful of stocks did a great job of masking a massive deterioration in breadth in the overall the stock market (see Issue #44). But now that these giants are falling, they’re in a position to take the entire market down with them.
This week’s nasty red candle on above average volume puts the bulls in a very vulnerable spot:

A break below this last line of support has the potential to take price back to the COVID crash lows. That’s my opinion based on nearly 18 years of experience, but it is admittedly subjective, so feel free to take it or leave it.
With a Trend Following approach, though, you generally want to move away from the subjective and more towards the objective, so let’s re-focus on what the objective rules of my strategy are saying.
I use a 100 & 150 day moving average crossover to segment the S&P 500 into bull and bear zones. Like a heavy, lumbering pendulum, the trend swung into a bear market in early May of this year (red arrow) and nothing has changed since then:
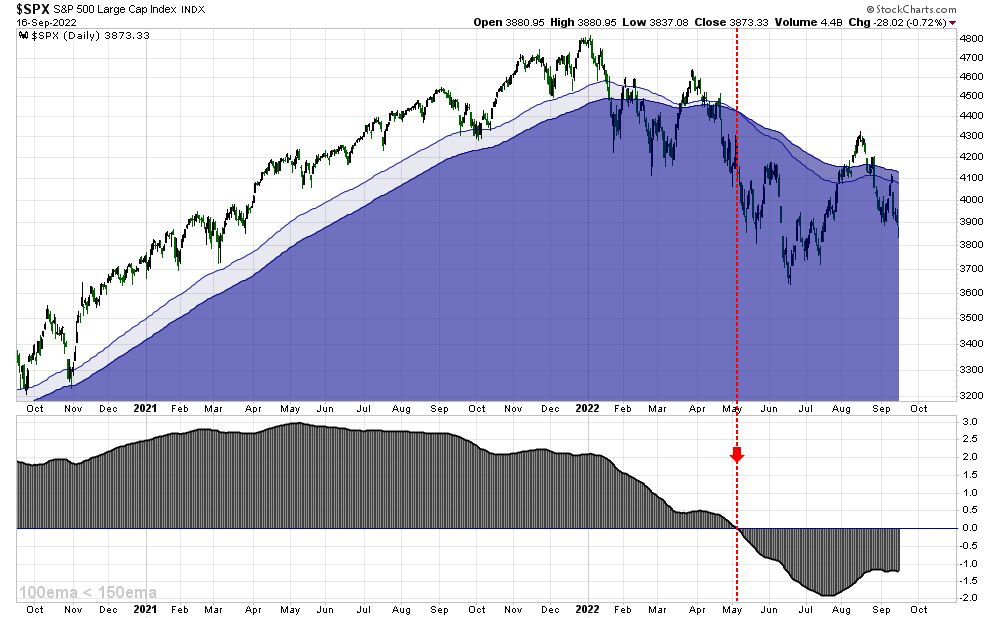
I mentioned last week that I’m buying stocks with a position size that’s 75% less than usual, and the chart above is the reason why.
At some unknown point in the future - it could be 2 months or it could be 2 years - the pendulum will swing back up and I’ll return to my normal position size.
Now there’s nothing really special about using a 100 & 150 day moving average. I just it use it because it does a reasonable job of defining long-term trends and also because it was highlighted in Stan Weinstein’s book “Secrets For Profiting in Bull and Bear Markets”.
An undoubtedly great book, I nonetheless dislike the word “Secrets” in the title, as there are no secret moving averages.
Different moving averages should simply be used to define trends on varying timeframes. For example, one could lengthen one’s timeframe by using a 200 & 250 moving average crossover. With this ultra-longterm approach, we can segment the market into bullish and bearish “super-cycles”, as shown below:
")
SPY with 200 & 250 moving averages (1999 - present)
Going all the way back to the year 1999, we can see that market entered a bearish super-cycle in early 2001 (dashed vertical line).
Then fast-forwarding to early 2008, another bearish super-cycle ushered in the Global Financial Crisis. The subsequent recovery led to a glorious new bull market, which lasted for over a decade right up until… now.
For the first time in 14 years, the market has entered a new bearish super-cycle. From this perspective, this is the very beginning of what has the potential to be a very challenging few years to come.
Trend Following Discussion:
Given that my outlook on the S&P 500 is so negative, you may be tempted to short the market. However, when it comes to shorting, I’ve said before that my focus is on new all-time-lows.
So if I can only short new all-time-lows, then how in the world would you ever short something like SPY? The answer is that you don’t.
It may be surprising to some, but the S&P 500 is a Trend Following system. Because it’s a market-cap weighted index, weak stocks are kicked out, while strong stocks remain and grow. The components of the index are always changing, always evolving.
Through the magic of indexing, the S&P 500 has a much better track record than just holding onto the average stock.
As the chart below shows, the S&P 500 has trounced the median stock in America by a huge margin going back 15 years:

Therefore, from this perspective, it doesn’t make sense to bet against a trend following system. Much better, instead, to focus on short-selling individual stocks.
Speaking of individual stocks, most of them actually don’t make investors any money. As Trend Following trader Eric Crittenden pointed out in his research, 75% of all stocks didn’t make investors a dime between 1983 and 2006:
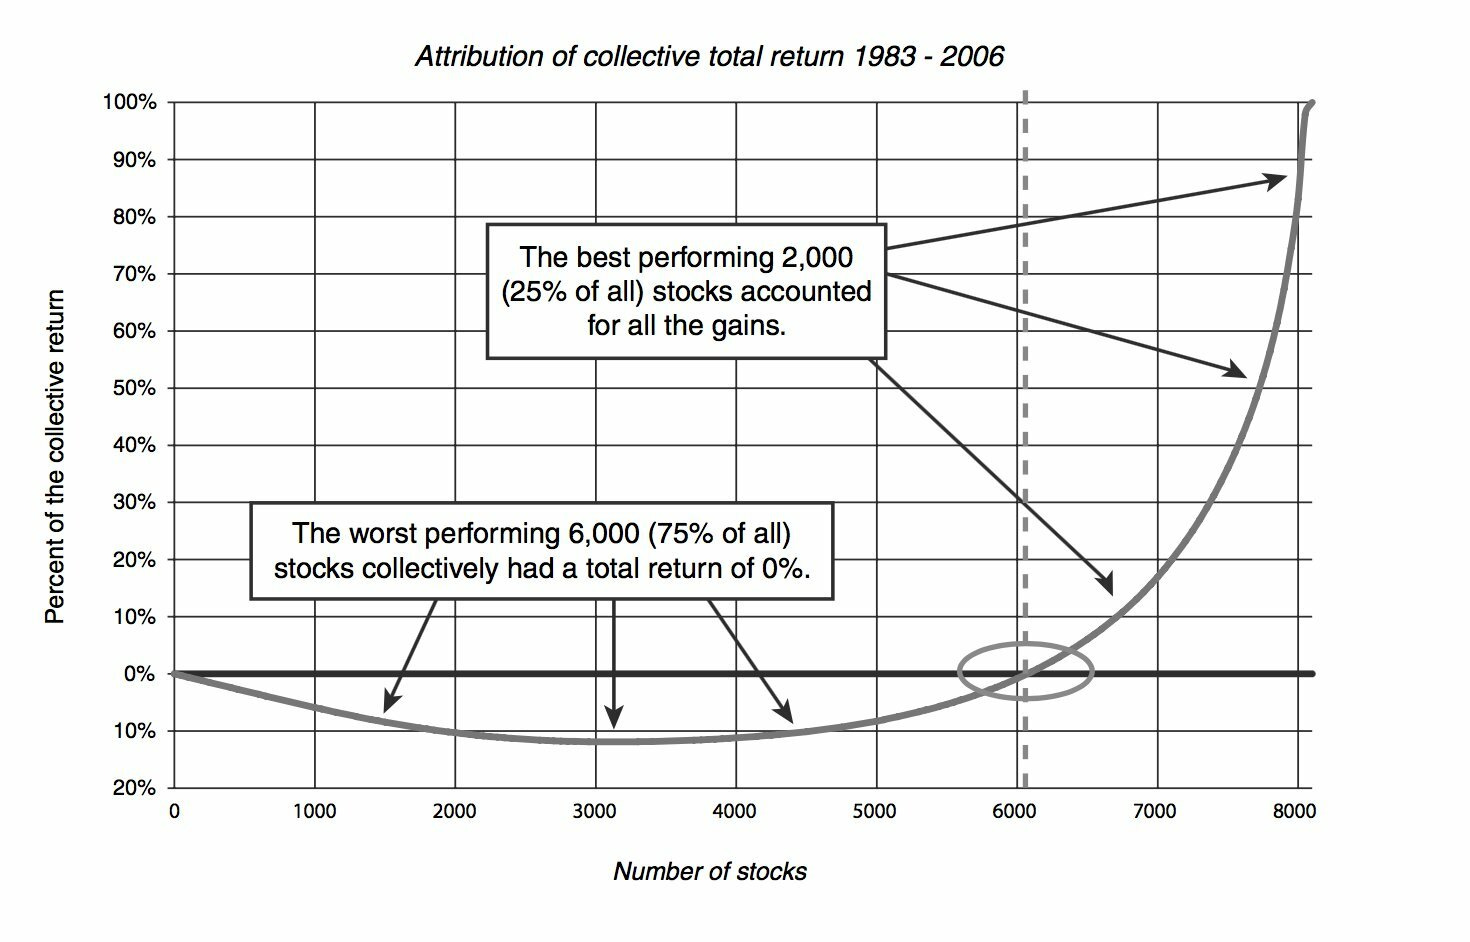
The key take away here is that a relatively small number of stocks drive the overall market higher, while most individual stocks are losing bets in the long-run.
So how might you be able to identify these few mega-winning names?
Is it by focusing only on the most innovative new technologies? Not really - one of the biggest winners this century has been Monster Beverage, not exactly a new technology.
Is it by doing balance sheet analysis? No, Amazon lost money for years as it soared higher.
The one common denominator of all super-performing stocks is that they make new all-time-highs over and over again.
Conversely, a common characteristic of any stock heading towards bankruptcy is that they make new all-time-lows.
In summary, getting into the habit of quickly scanning for new all-time-highs and all-time-lows is a great place to find your next trading idea.
Bitcoin:
The largest exchange traded fund in the world of crypto is called the ProShares Bitcoin Strategy ETF. That’s an interesting name since it doesn’t actually contain a single Bitcoin and also because the fund has absolutely no strategy.
I could live with an ETF that relies on futures contracts as long as it did a good job of tracking the underlying, but in the case of BITO that’s not happening.
Besides losing its investors a tonne of money since it launched 10 months ago, the fund has also underperformed “physical” Bitcoin by about 5% since then:

BITO versus Bitcoin
Other than BITO, there is another fund - GBTC - but, as the chart below shows, it too has greatly under-performed Bitcoin itself:
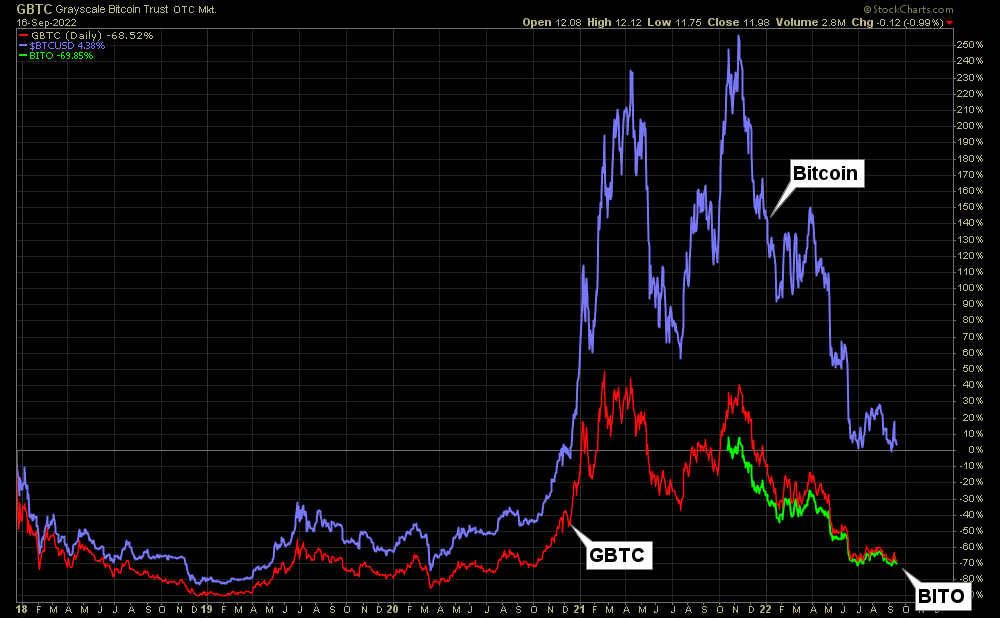
In terms of actual Bitcoin, from the start of 2018 until today, its rate of return has amounted to a whopping 4%. That’s a compounded annual growth rate of about 1% along with periodic drawdowns of over 80%.
The Bitcoin cult members, of course, will say that I just “cherry picked” my timeframe, but there’s no denying that the last 5 years haven’t been working for the hodlers.
The problem with “hodling” is the same as holding on to individual stocks. Just as 75% of stocks lose money over time, inflexibly holding onto any asset class isn’t a good idea.
I realize that Bitcoin seems like some incredible, hot new technology to some, but study market history, and you’ll see hundreds of “new technologies” crash and burn: RCA Radio, General Motors, Polaroid, Kodak, Xerox, Blackberry, etc…
The Trend Following mindset is to never statically hold on to anything. Like the S&P 500, you need to always evolve, reshuffle, cut losses.
Back in March of 2021, when Bitcoin was trading north of $60,000 I sarcastically tweeted what amounted to the polar opposite of what I actually believed in:
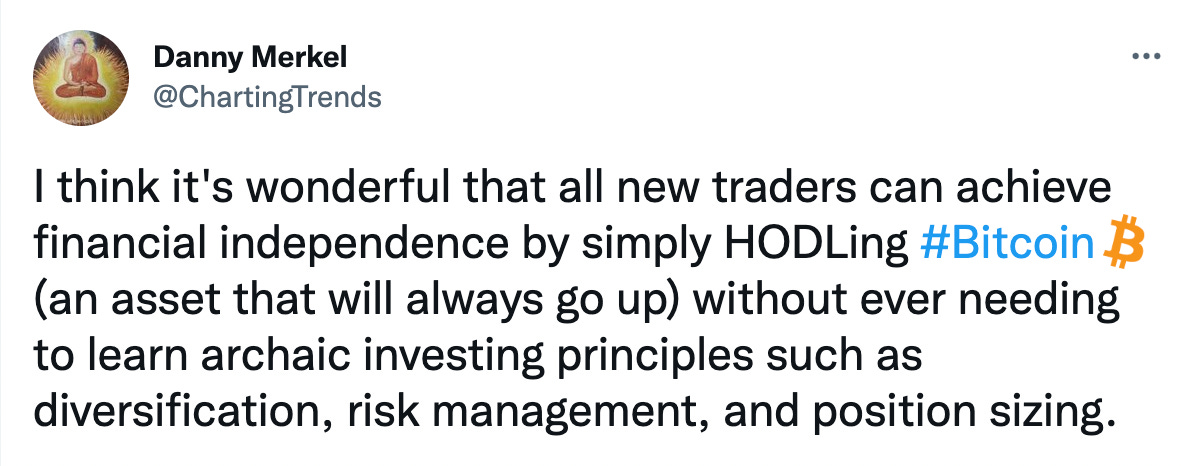
Looking back at this crazy, frothy time I’m not sure if readers got the sarcasm, or perhaps they thought I was off my medication again, but either way there are, unfortunately, no easy shortcuts to building wealth.
Current Holdings:
Here are my holdings going into next week: