

Weekly newsletter of Danny Merkel - Issue #96

Member Q&A:
Let’s start with a member question and go from there.
Question: If you sell when a stock breaks below an up trending 20dma after a long uptrend why don’t you buy when it breaks above it after a long downtrend?
Answer: The reason is that I never want to be in a position where I’m fighting the long-term trend.
The long-term trend is very important as it helps to put the odds in your favour and also keeps you out of weak, low probability setups.
For example, by looking at the 20dma alone (in blue) and ignoring the more important long-term trend, we can see that the ARK Innovation ETF would have generated numerous weak, low quality buy signals:

ARKK with 20 day moving average only
The chart above generates dozens of whipsaw signals as price repeatedly bobs and weaves over and under the 20dma.
If you want to buy 20dma breakouts, that’s something I would do only if the long-term trend is moving in your favour. Much better to swim with the current than against it.
As you may have noticed by now, I use a 100 & 150 pair of moving averages to define the market’s current.
By applying these moving averages to ARKK and removing everything else, we get a chart that looks like this:

ARKK with nothing but the 100 & 150dma
The market tide turned positive in December of 2019 (dashed red line) and so buying breaks above the 20dma at that time would’ve been okay.
The bull market that unfolded during the next year was incredibly powerful, so it really didn’t matter what your strategy was - if you were long, you made money.
During strong bull markets, it can be difficult to differentiate the professional trader from the gambler. Both will be making money, and both will be long similar stocks, such as Tesla, but there are a few critical differences.
Even though I was long Tesla in 2020 like everybody else, I also followed very strict and precise position sizing rules.
Back in 2020, I tweeted exactly how I would size a position to ensure that I didn’t lose more than 1% of my account capital:

Hard to believe this didn't go viral.
My position sizing rules involve only addition, subtraction, multiplication and division, yet I think a lot of people see a spreadsheet and their eyes glaze over.
Basically, 2 X 23.155ATR X 22 shares = ~$1,000. I don’t want to lose more than 1% of my account capital on any single trade.
The amateur trader? Go big or go home. Bro, just take a huge position and, like, when it goes up, just sell it and you’ll have a big profit.
And so with recklessly large positions, there were a lot of traders who had outsized rates of return for the year 2020.
There are some who might say that since it all worked out in 2020, that this kind of hyper-aggressive trading was worth it. It paid off.
But my view is to focus on the process that got you the results, rather than just the outcome. To illustrate what I mean, let’s say - purely hypothetically speaking - that we played a game of Russian Roulette whereby each time you pull the trigger, I give you $100,000 in cash.
It’s quite possible that you end up becoming a millionaire playing this game. But becoming a millionaire is the result; the process is terrible and if you repeat it often enough, you’re dead. Likewise, if you go “all in” on a stock, maybe it pays off in the short-run, but in the long-run, you’re going to go broke.
Anytime anyone goes “all in”, there is a risk that the stock gaps down 50% or more. It may be unlikely, yes, but if you trade long enough, it’ll happen. It’s like playing Russian Roulette with your account, but instead of 6 chambers, there are perhaps a thousand, so it can take a while until the bullet finds you.
As a weird side note, the odds of losing in Russian Roulette are not 1 in 6 as is commonly believed since the weight of the bullet combined with the centrifugal force involved with spinning the chamber helps it settle at the bottom. Still not recommended though.
Moving on… so you have all these lucky traders with fantastic rates of returns at the end of 2020. These massive profits trigger all sorts of hormonal changes in the trader and addicts them to repeating whatever it was they were doing.
Which leads to another major difference between professional traders and gamblers. Pro-traders stop trading when the odds are no longer in their favour. Gamblers keep trading, pedal to the metal.
And so when the trend for ARKK turned lower back in March, 2021 that was a reasonable cue to stop.
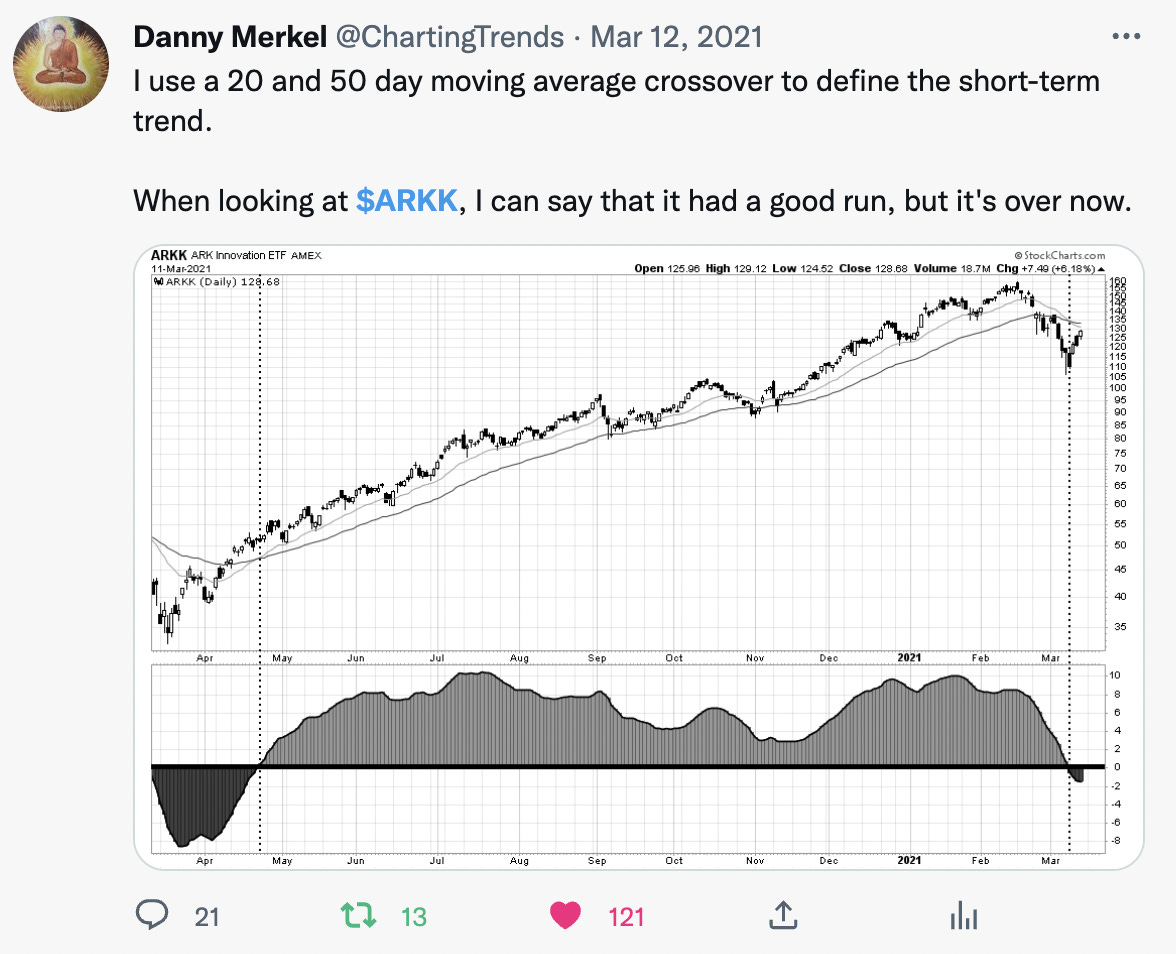
Mentioning that two simple moving averages had crossed over seemed like a fairly harmless tweet yet, to my surprise, it generated a lot of hateful messages. What do you mean it’s over?
Individual Stocks:
Quitting the growth stock addiction has mostly paid off since March 2021, due to the fact that so many names have been crushed since then, however one stock has held in there, grinding sideways for the entire time: Tesla.
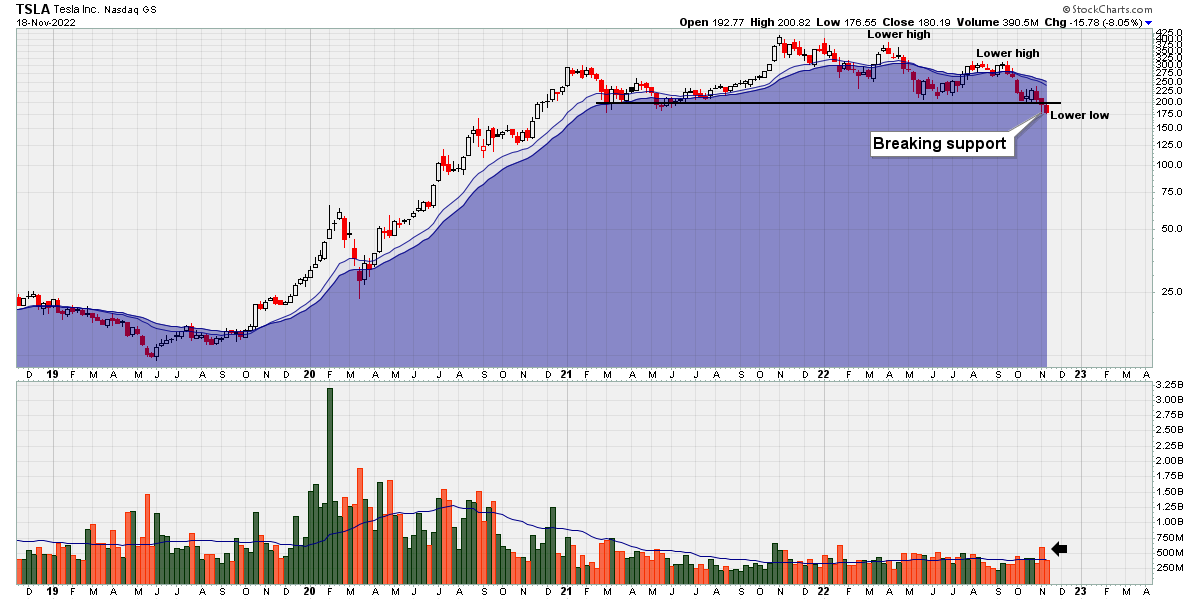
As I mentioned previously, a break below this lengthy consolidation area could potentially be bearish and that appears to be happening at this moment.
With a new lower low just printed, it’s a long way down before price hits any logical support level.
Despite an ugly looking chart, Tesla remains a crowd favourite. It’s a familiar name, or perhaps it’s because they’re in love with Musk, but that’s a lousy reason to own something.
If you’re doing things right, your next trading idea should originate from your stock scans and will, in all likelihood, be something you’ve never heard of.
Put another way, there are thousands of stocks to choose from, so why would you buy Tesla. What are the odds that it’s the best looking chart right now?
Stock Scans:
On Friday, the QQQ was up $0.01, which in my opinion encapsulates the stalemate market that we’re in - no major progress on either side, just a never ending chop-fest.
Beneath the surface of the Nasdaq, though, we can see that 29 new stocks made new highs on Friday. That’s a reasonable place to look for your next trading idea, assuming you want momentum on your side.

Focus on new highs & lows and ignore the rest
Meanwhile, as 29 stocks were making new highs, there were also 96 stocks on the Nasdaq making new lows.
That’s precisely the “we’re not in a healthy bull market” scan result that I’ve mentioned before. New bull markets should produce long lists of vibrant new stocks making new highs and that continues not to happen.
Dividends:
There’s a lot that can be said about dividends and you probably have your own views, but what I will offer is a purely Trend Following perspective.
The word “dividend” does not appear anywhere in my trading rules, so officially they’re not a factor in any of my trading decisions.
That being said, if I buy a stock and it pays a dividend, then that’s great. But it’s the icing on the cake, never the cake itself.
It just so happens that now I’m receiving a lot of dividends each month. That’s because my largest holdings are in monthly dividend paying ETFs such as BIL.
With an ETF such as BIL (shown below) the dividend is the only thing going for it. That’s why when interest rates were stuck at zero last year, BIL didn’t do anything - it just drifted sideways:

But with interest rates on the move higher this year, my scans identified BIL when price made a new 52-week-high in May (red arrow).
To be clear, though, I bought BIL because price was making a new 52-week-high, not because I wanted to receive its dividend.
A central theme I’ve repeated for months now is that the market is dead from a trend-following perspective. In the past, I’ve called it a Kangaroo market, and lately thought of it as akin to trench warfare, meaning that no progress can be made by either the bulls or bears.
And because the market has become such a chop-fest, most traders would be better off earning interest in conservative, interest paying ETFs.
In issue #86, I covered a variety of other ways to put your idle cash to work and this next chart shows one of the ways outlined in purple versus the messy, broken price action of the Russell 2000 in red:

With the benefit of hindsight, it’s becoming increasingly clear that the purple zone is offering more reward with a lot less headache.
But the fact that I avoided the Russell 2000 is not really hindsight bias. I buy ETFs that are making new highs, and the Russell 2000 has made exactly zero new highs this year, thus producing zero buy signals.
Meanwhile, the conservative, income paying ETFs were the only thing that appeared on my scans, and so that is the reason I started buying them.
In other words, I wasn’t striving to earn dividend income. I was buying ETFs making new 52-week-highs and it just so happened that they paid large monthly dividends.
So that is the Trend Following perspective on dividends, but it is certainly not the most common point of view. There are a lot of investors who actively seek out dividends.
I remember, back in the year 2008, when I sold mutual funds over the phone, I’d always get investors calling me asking when the ex-dividend date was for a fund and then scheduling a buy of that fund a day before.
The idea was that it was like a free bonus that you could snag if you were smart enough to buy right before the dividend.
I never bought into this free lunch idea, as the market bakes the dividend into the price action, but I wondered if enough people pile into a stock prior to the dividend, would it create an updraft that I could profit from?
This theory was put on the back burner until I discovered an intriguing book written by Nick Radge called “Profiting From Dividend Momentum”.
At this stage, in 2013, I was really doing a deep dive on this guy Nick Radge, reading everything he ever published and so naturally I was curious to see his thoughts on dividends.

If you can get past the annoying cover, the book itself is very good
In a nutshell, Radge proves that there is a momentum effect on high dividend paying stocks that occurs within a short window of time prior to the ex-date.
In next week’s issue, I’ll unpack the exact rules of the strategy and provide practical examples.
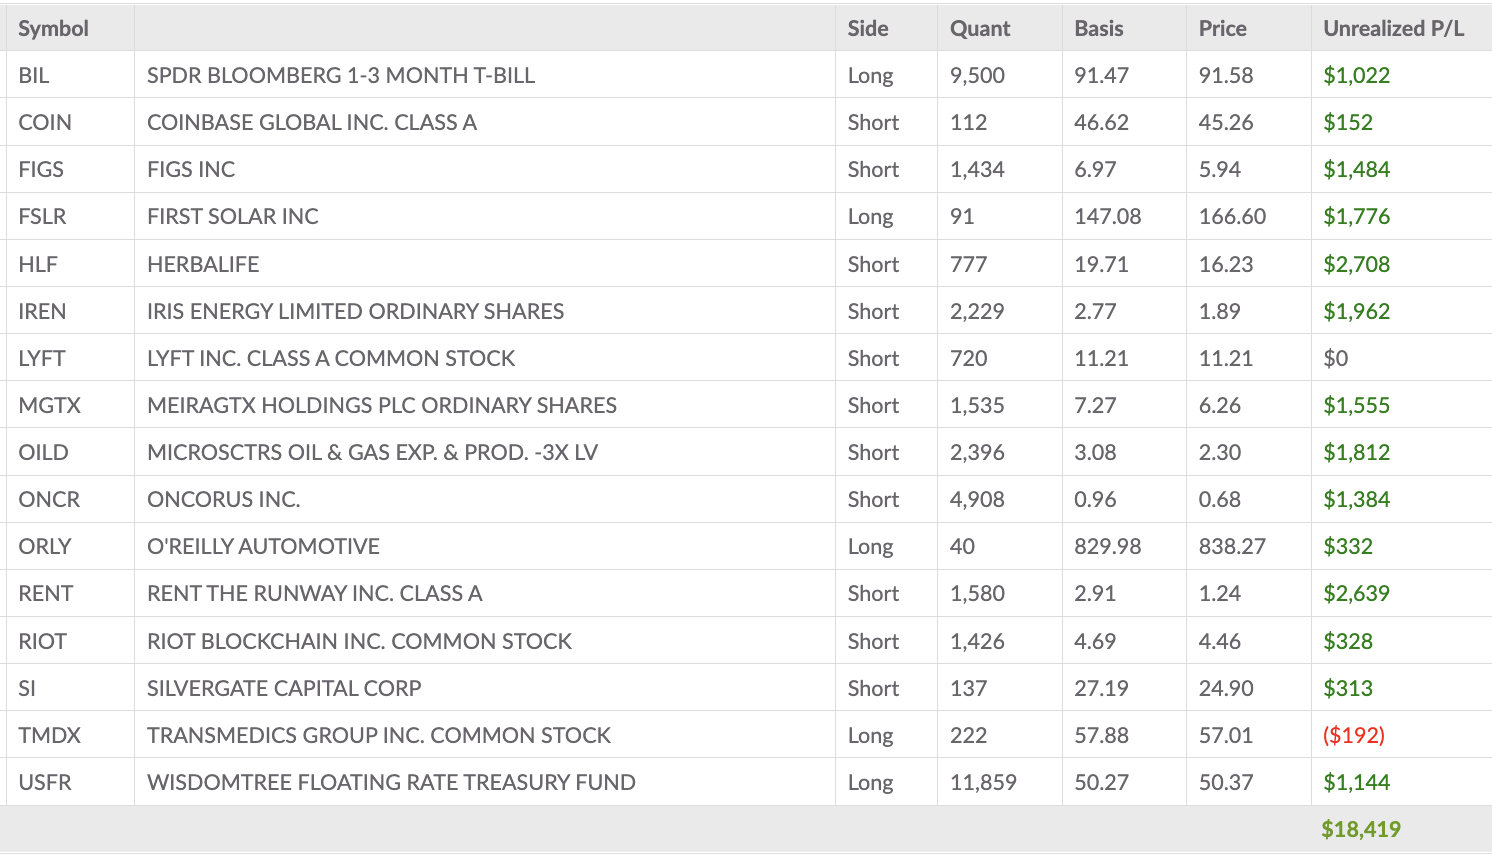
Current Holdings:
Here are my holdings going into next week:
In my opinion, Trend Following has entered a kind of dead zone whereby not much of anything is happening.
To make money, TF traders need movement and most markets -whether it’s Crude Oil, Gold, Natural Gas, Wheat or the S&P 500 - are more or less at the same levels they were 6 months ago.
That being said, there will always be individual stocks making new highs and so I’m trying ORLY as a new position as well as FSLR.
In terms of new lows, I’m giving SI and IREN a whirl, but they’re very small positions.
What are my top ideas going into next week? Scan for new 52-week-highs each day and see for yourself.
Quote of the Week:
