

Weekly newsletter of Danny Merkel - Issue #84

Market Review:
The question that’s on every trader’s mind is whether we’re in a new bull market or not.
In my opinion, this has been nothing but a bear market rally and there was a lot of price action this week that supports this view.
Two weeks ago, I posted a chart of the Russell 2000 along with the RSI indicator. The astute reader may have noticed that I placed a question mark in the top-right corner. The question I was asking myself was “is this a bull market or not?”
In a bull market, the RSI indicator should become overbought and stay overbought. That’s a sign of strength and a sign you want to get involved on the long side.
However, what actually happened is that as soon as an overbought level was reached, the market (once again) turned on a dime and pulled back. Hard.

Another central argument that I’ve been making for more than a year is that the bull market ended on February 16th, 2021 and, since that time, air has been slowly leaking out of a gigantic speculative bubble. If this is true, it would explain why every overbought signal ends in disappointment for the bulls.
The next clue that we’re in a bear market rally is that S&P 500 failed to crack through the 200dma.
If you study market history, one quickly realizes that bad things tend to happen below the 200dma. That’s why great traders focus on playing superior defence during times like this, and one way to do that is to simply hibernate in cash.
As I’ve mentioned before, there is an ETF that does exactly that. Trading under the symbol PTLC, the fund is preserving capital by doing nothing but holding cash.

It is said that Trend Following is simple, yet quite difficult to implement. For example, the rules that govern PTLC are incredibly simple, but how many traders have the patience to sit on their hands for weeks on end?
Zooming out to the weekly chart, the picture doesn’t improve. The Nasdaq Equal Weighted Index’s bear market bounce fits within the context of a massive rounded top formation.

In addition, the lower highs on the weekly chart suggest that the bear market never ended and that this is a bear market today.
Individual Stocks:
The price action of leading stocks continues to be atrocious. In fact, going over my trading records, the last time I bought a stock and actually sold it at a higher price was in April.
One could make the argument that I’m just a terrible stock picker and, while that could be a factor, I’d like to think it’s not just me.
In this toxic market environment, even the best stock traders, such as Mark Minervini are having a very tough time. You can prove this to yourself by scrolling through his Twitter feed and observing how his past picks have done.
For instance, on August 17th, he called SIGA a “new potential leader”, which almost perfectly nailed the top of the move.

Next, Minervini highlighted World Wrestling Entertainment in mid-August. That also perfectly nailed the top as the stock pulled back hard.

I could provide a hundred other examples, but you get the point. To be clear, though, I’m not trying say that Minervini is a lousy trader. Far from it. Rather, my point is that if someone with 35 years of experience is struggling, what does that tell you about the health of the market? Does this still look like a bull market to you?
Commodities:
Buying breakouts isn’t working because we’re in a bear market.
But what if you were open minded and traded other markets, besides stocks, that were actually in a bull market? This radical, outside the box thinking is what Trend Following trading is about.
Take a Trend Following legend such as Jerry Parker. He trades over 200 different markets, both long and short.
Using a 200 day channel, Parker went long Crude Oil in late 2020 and is still long today:
")
Once again, a very simple approach, yet difficult for most traders to implement. Could you hold Crude Oil and do nothing for 18 months?
Currencies:
Using the same Jerry Parker style of trading, we can see that the US Dollar is also in a bull market.

I don’t personally use a 200 day price channel breakout in any of my trading, but I point it out here to show that there are many ways to define and capture trends.
An alternate approach, one that I do use, is a 20/50 moving average crossover. These moving averages, which I use to define the short-term trend, have been in a continuous uptrend for over a year:
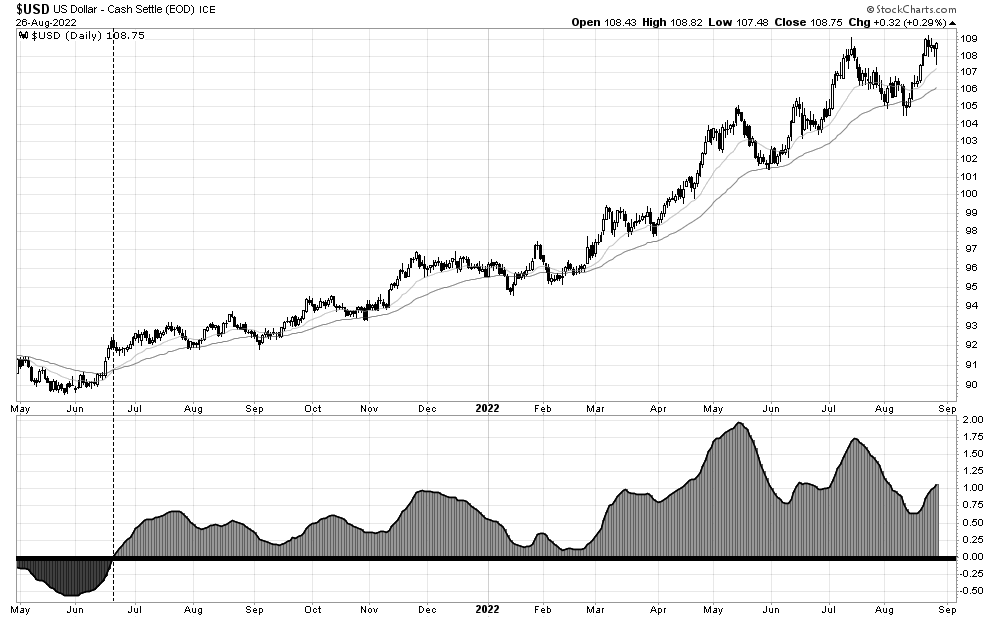
But because the US Dollar has already gone up so much, one might think that it’s too late to enter.
However, this next chart shows a much longer term perspective. A monthly chart going back a decade, the chart below illustrates a massive, multi-year breakout to new highs.
")
US Dollar Index - monthly (2011 - present)
So if you’re doing Trend Following correctly, you need to be long the US Dollar right now. It’s in an uptrend on every timeframe.
But how do you gain exposure to this index? If you just have a normal stock trading account, you may not be able to trade futures or Forex, so we’re left with ETFs.
The problem with a lot of ETFs, however, is that they tend to do a poor job of actually tracking the index. On the other hand, some ETFs (such as SPY) actually do a great job of tracking the S&P 500, so how can you tell if the ETF is good or bad?
The answer is to take the ETF and divide it into the index to get a ratio chart.
For example, the fund that tracks the US Dollar Index is UUP, so let’s take that and divide it into the index itself.
The end result is that UUP actually was doing better job than the index throughout 2018 and 2019. That’s because the fund parked surplus cash into T-Bills which paid interest, helping to juice up the total return of the ETF.
But that outperformance came to an end in March of 2020 (dashed vertical line) when interest rates were cut to zero. From that point, the ETF’s management fees chipped away at the fund creating a slight downward drift until recently.

As interest rates are on the march higher again, I predict that UUP will once again start outperforming the index.
All in all, this is a reasonable fund to buy to gain exposure to strength in the USD and is a fund that I personally hold at this moment.
Interesting ETFs:
I mentioned Jerry Parker previously and he is what you might call a classical Trend Following trader.
Another example of a classical Trend Following trader is named Salem Abraham. I was first introduced to Abraham in Michael Covel’s film “Broke the New American Dream” and you can watch a clip of this documentary here.
Similar to Parker, Salem Abraham follows trends in an extremely wide variety of different markets and this, in turn, can provide true diversification to a long-only portfolio.
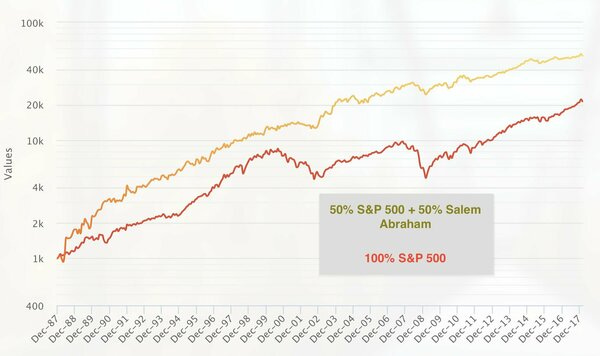
Because this unique approach is completely uncorrelated with the S&P 500, one can improve returns and dramatically reduce drawdowns by blending it into a long stocks portfolio.
As an example, a 50/50 blend of the S&P 500 and Salem Abraham improves returns and irons out multiple 50% drawdowns in the market.
Although I’m a fan of classical Trend Following traders such as Jerry Parker and Salem Abraham, I have never personally invested any money with them, as I’m not even sure if they accept non-American clients and also because I prefer to keep my funds within my own brokerage account.
But now there is finally an easy way to gain exposure to all of the benefits of this style of trading in a convenient and easy to trade ETF that I only just recently discovered.