

Newsletter of Danny Merkel - Issue #148

Market Review:
The past 18 months have been challenging for momentum traders, but there are many signs that this difficult time is coming to an end.
After going nowhere for 2 years, the S&P 500 total return index (SPY) reached a new all-time-high this month.
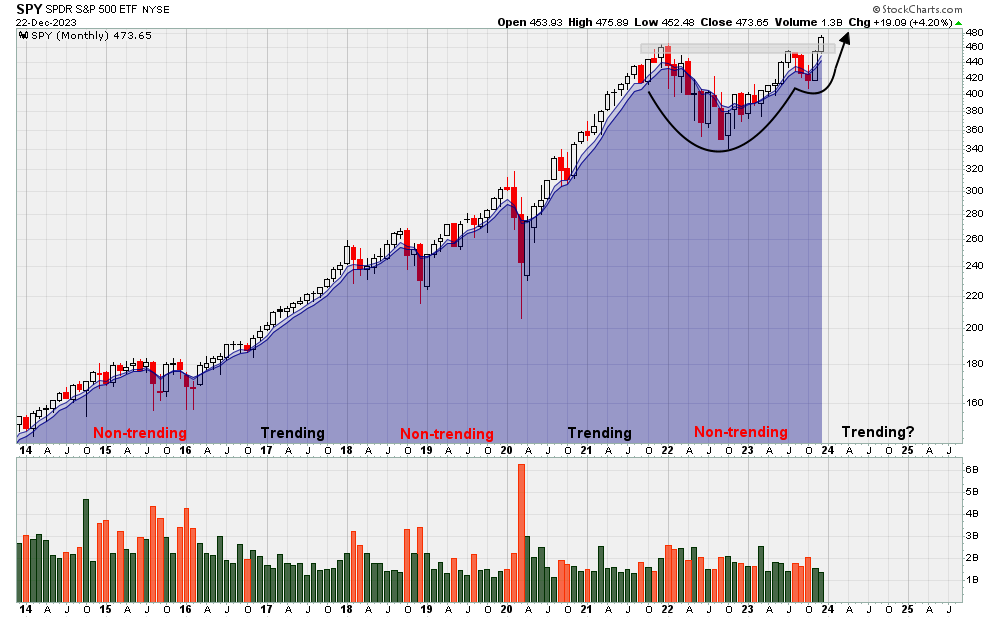
A new all-time-high means that everybody who is long is making money; everybody who is short is losing money. Put another way, if you’re bearish at new ATHs, then you’re wrong. It’s just that simple.
The chart above also highlights that non-trending periods often lead to trending periods.
For the past 2 years, the market has been non-trending. Did you know that the average stock in the S&P 500 is very close to perfectly flat since January 1, 2022:
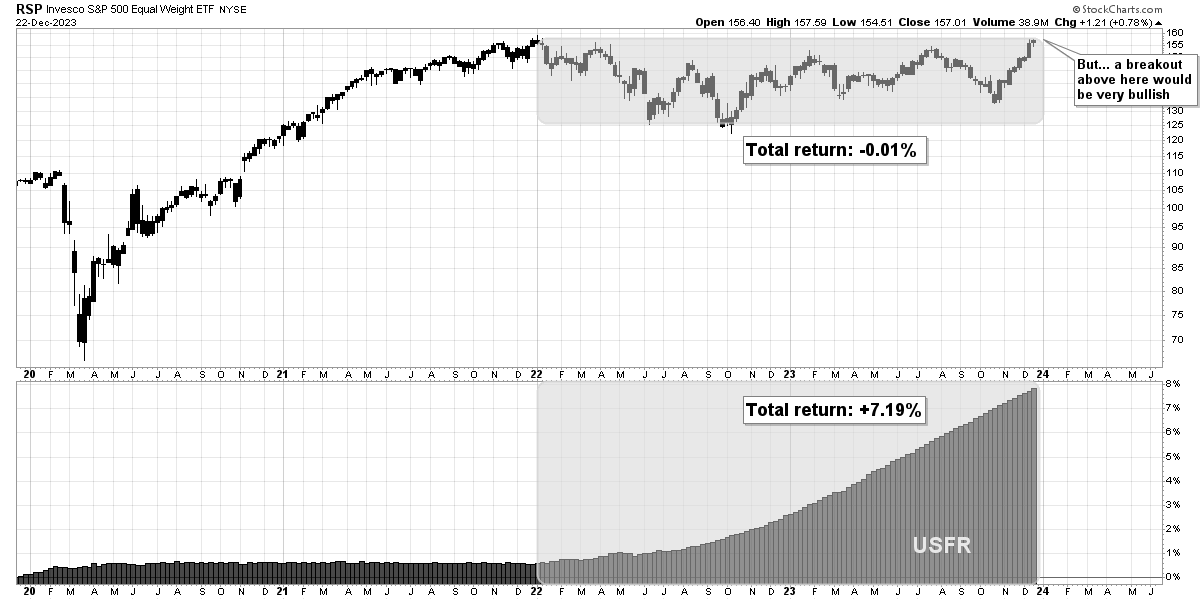
The average stock in the S&P 500 (including dividends) has been so weak, that keeping your money in T-Bills (USFR) would have done much better. Not exactly a raging bull-market.
But a breakout beyond the grey shaded zone above could be very bullish. Stocks greatly outperforming cash in 2024 is a likely scenario.
Another sign that stocks have been weak is that international investors haven’t made a dime in the S&P 500 in 2 years.
For example, in terms of the Euros, US stocks have been dead money, just grinding sideways.
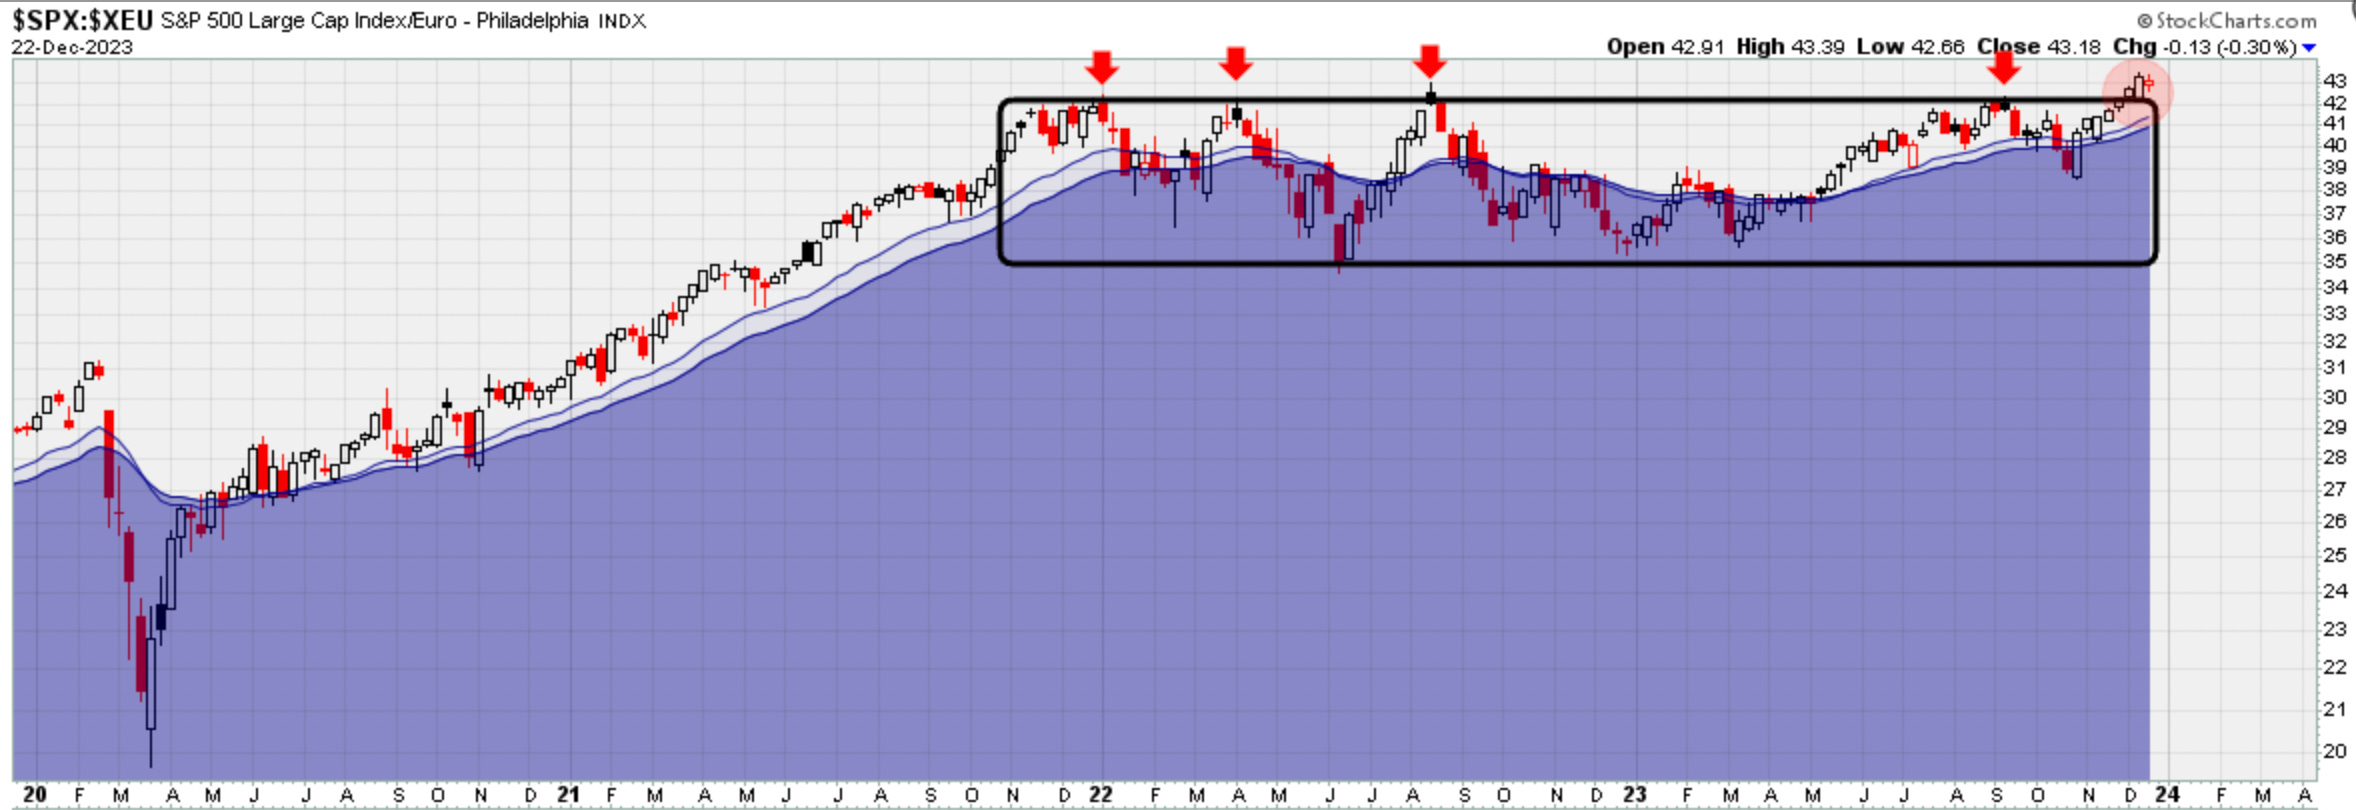
The good news, though, is that price is breaking out of the box. Once again, this shows a transition from non-trending to trending.
Similarly, momentum stocks could be undergoing the same transition. Throughout 2023, momentum as a strategy has underperformed massively, as shown in this monthly chart below:
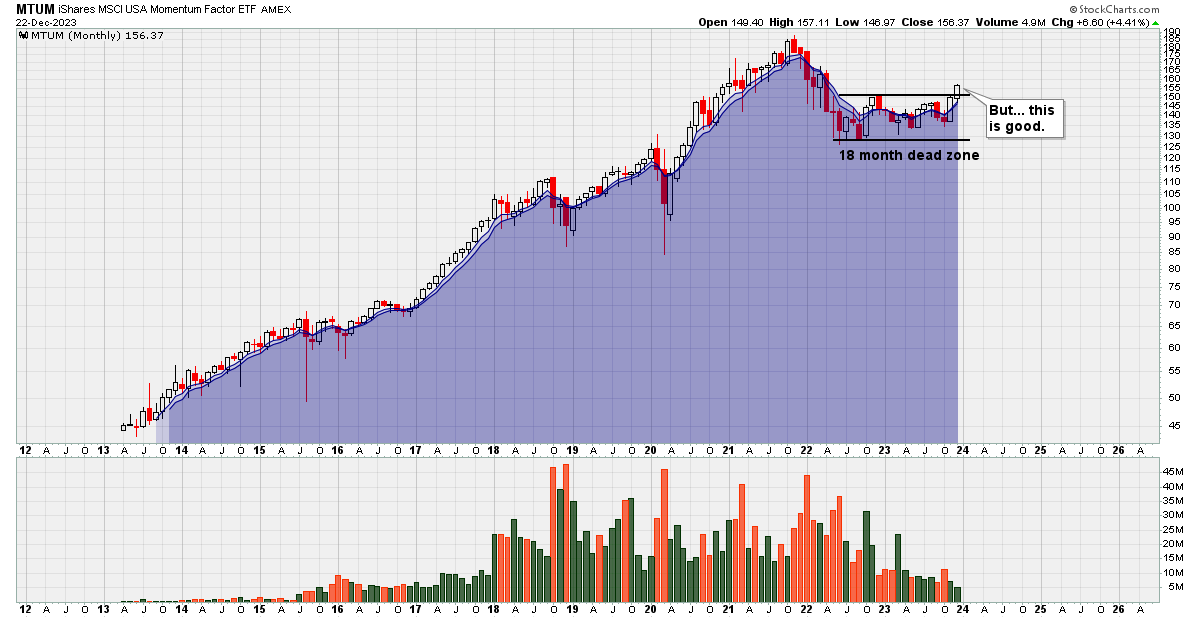
The good news, though, is that price has finally broken free from an 18 month dead zone.
Until recently, the weakest area has been small stocks. Many traders, including myself, took this weakness as a warning sign, but this ended up being incorrect.
Now if you were bearish on small-caps, you might have bought an ETF such as TZA, which is the leveraged inverse fund. Had these bearish traders been right, then TZA would have soared.
However, the opposite happened and TZA has been melting down, hitting a new all-time-low:
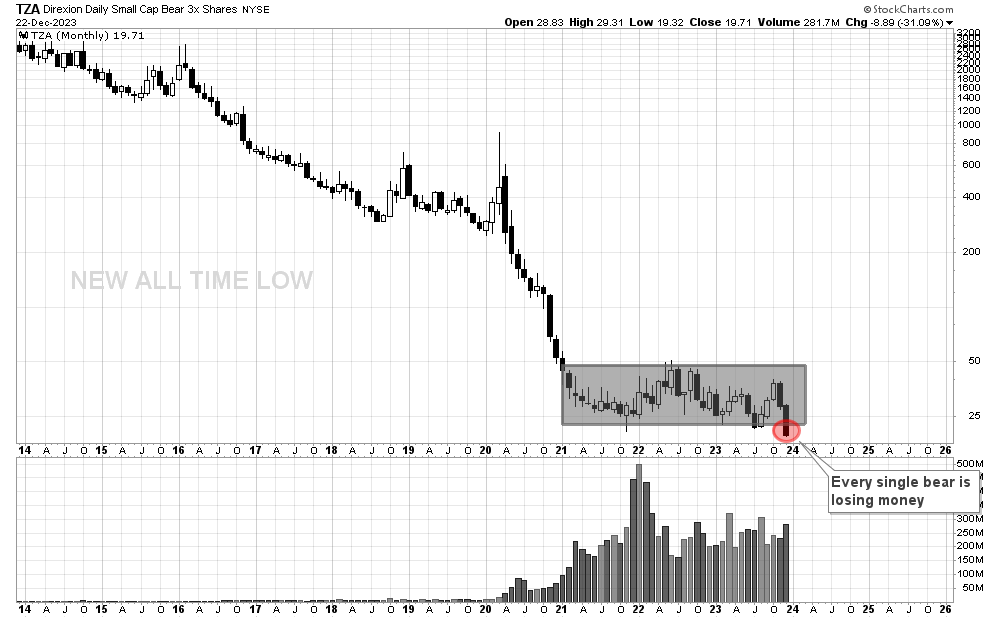
This is important: every single trader who made this bearish bet is losing money. If you own something that’s making a new all-time-low you are wrong and the market is right.
Furthermore, once again, the above chart shows a transition from a non-trending to a trending zone.
During non-trending periods, trend-following strategies look dumb, as I explained last week. In contrast, counter-trend strategies look smart.
For instance, I came across this tweet that describes a counter-trend approach:

New traders love this kind of thing. I mean look at it, it nails every top. And it’s better than RSI… it’s the Bullish Percentage Index… sounds fancy.
After reading the comments, it’s as though this lady has bestowed the world with the holy grail of trading.
There’s one problem though: the chart only goes back 2 years - the exact two years where the market hasn’t trended.
With the benefit of hindsight, you’re taking a snippet of where markets didn’t trend and applying a counter-trend approach.
Now just as everybody has assumed that this latest “overbought” reading is a sell signal it could easily be the time where, as I have explained, the market is transitioning from non-trending to trending.
If that is the case, overbought will just become more overbought.
Individual Stocks:
With SPY at new all-time-highs and the trading range showing signs of ending, I’ve been adding new stocks to my portfolio.
If you hated the option trading strategy and just prefer buying strong individual stocks, then chances are you are going to like this newsletter a lot more now and going into 2024.
I buy stocks breaking out of bases to new highs, preferably all-time-highs. A recent example of this has been NTAP, which I did buy this week:
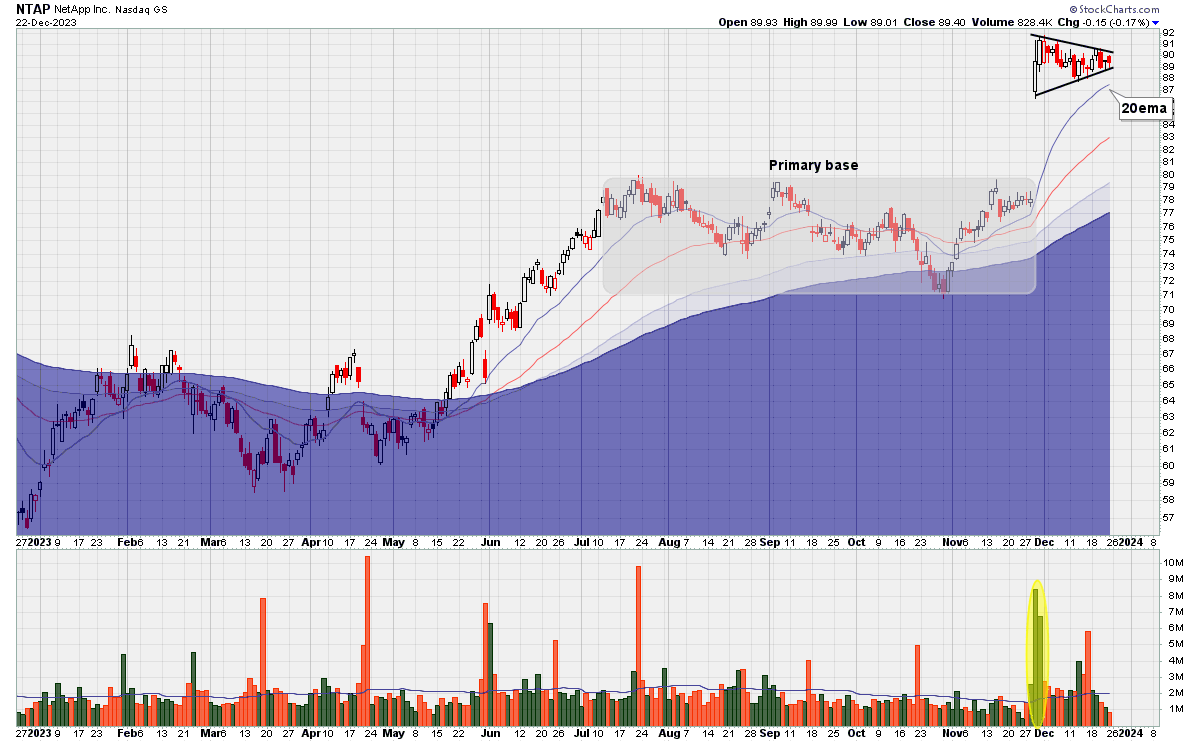
When it comes to stock picks, this is normally where a tweet would end. I like NTAP and I have a position. End of story.
From a Trend-Following perspective, however, there are many pieces of the puzzle that are missing.
In his excellent book, The Complete Turtle Trader, Michael Covel summarizes the 5 questions any trading system must answer:

So far, we’ve only answered question #1.
The next question, the question of how much, is paradoxically incredibly important, yet never talked about. Here’s a challenge: read 1,000 tweets from the favourite people you follow and count how many times they discuss the “how much” question. My guess? Zero.
Remember, that financial risk is dose dependent, similar to medicine. A small amount could be beneficial, but too much can also kill you.
Imagine yourself sitting at doctors office and receiving a bottle of pills for a medical issue that you are experiencing. On the bottle, there are no instructions, so you ask the doctor how much you should take.
Now imagine the doctor telling you not to think about it too much, just do what comes naturally. If you’re feeling bold, just take half the bottle at once and see what happens.
What if he said swallow as many pills as it takes to feel the effects, but not so much that you can’t sleep at night.
As absurd as that sounds, that’s exactly what a lot of stock traders are doing. Trade a big position, but small enough so that you can sleep at night. I hear that a lot, but deep down, you must surely know that’s a bullshit strategy.
Let’s discuss my position sizing strategy.