Market Review:
Three years ago, central banks around the world panicked and flooded the economy with a level of stimulus never seen before.
Like any stimulant, this created benefits in the short-run, mainly in the form of a speculative frenzy.
All stimulants wear off, however, and short-term gain transitions into long-term pain.
In my opinion, growth stocks are still experiencing the blowback from the aforementioned greatest policy error in a generation.
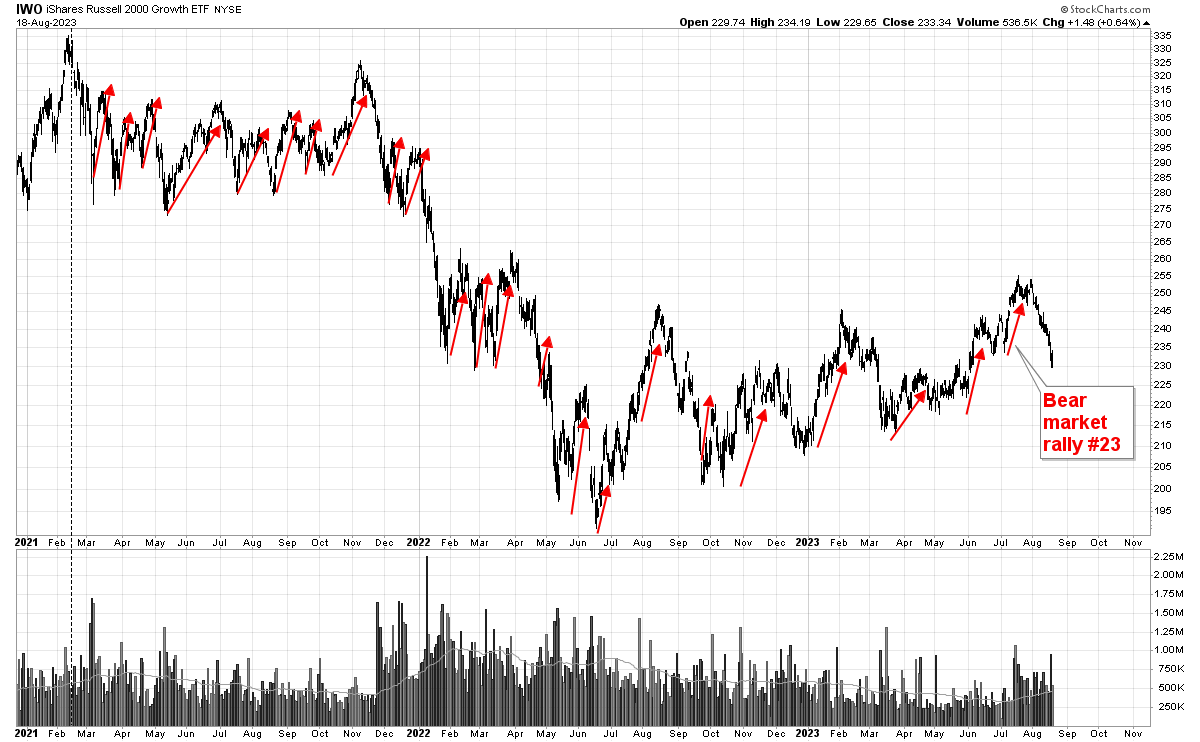
Like a burnt out drug-addict, growth stocks - shown below - are just a shell of their former selves. Confused, dazed and disoriented, every rally fails:
This is not the product of a normal, prosperous period. Times of prosperity - such as during the 1920s, 1950s, 1960s, 1980s or 1990s have never produced over 3 years of erratic, choppy price action as shown above.
The cure for this hangover would have been a thorough bear-market to refresh sentiment and clear out excesses.
Unfortunately, the recent bear market was short and shallow and did not provide the kind of refreshing restart that prior bear markets did.
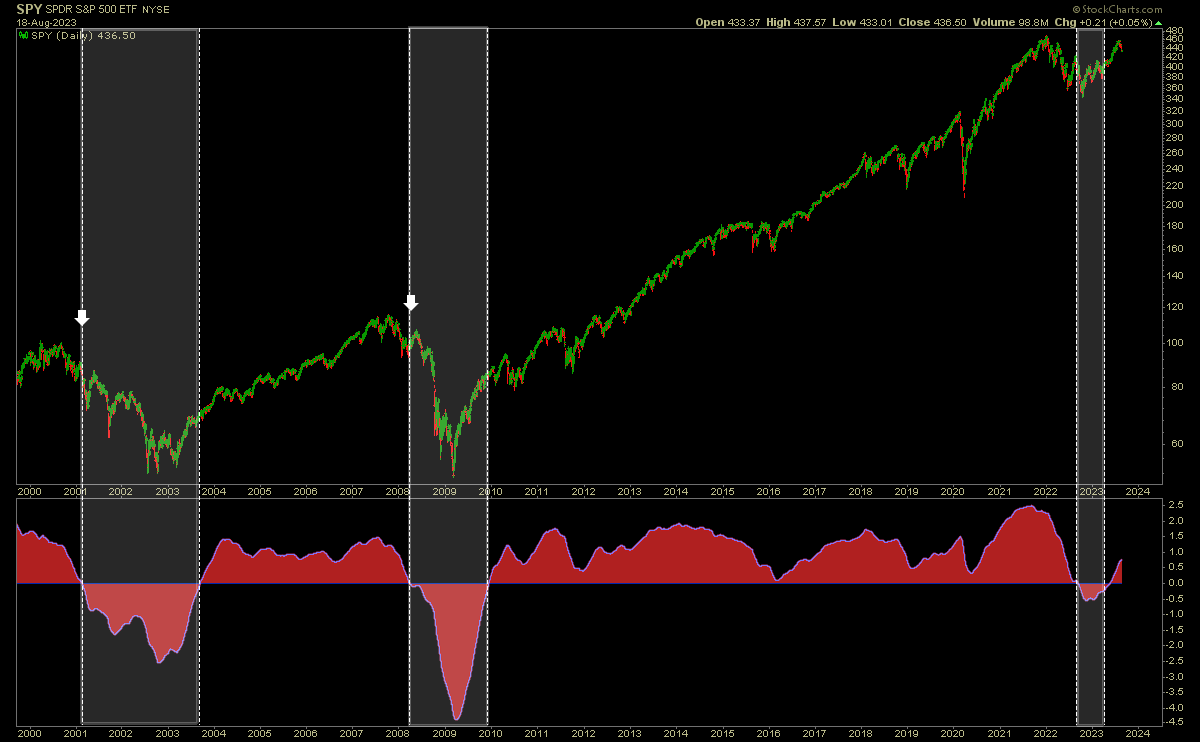
Referring to the chart below, notice the length of the 2001-2003 bear market. Lasting 3 years, this bear market was hugely effective at restarting sentiment and setting the stage for a fresh, new bull market in 2003:
Moving forward, the bear market in 2008 wasn’t as long, but was much deeper, allowing sentiment to be refreshed. The bull-market that followed, in 2009, was sharp and robust, completely different from today’s so-called bull market.
Because the bear-market last year was both short and shallow, it never got the rest it needed, leading to this half awake, half asleep price action we have today.
Individual Stocks:
Chances are that all of the trading books you’ve read were written in the 1980’s, 1990’s or 2000’s during periods of strong bull-markets.
Naturally, momentum strategies worked great during these times. The problem today, however, is that we’re actually in a high-volatility trading range and not a bull-market.
The massive problems in the stock market and economy today are more akin to the 1970s and there were very few trading books written during this time.
Anyway, I’m trying (without much success so far) to formulate a strategy that does well in trading ranges.
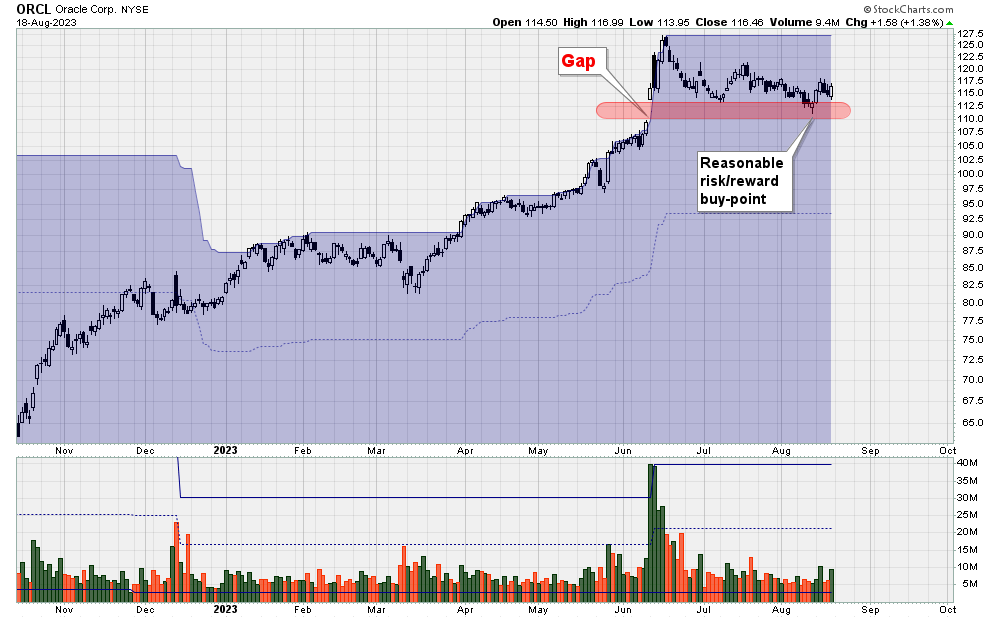
For example, ORCL gapped higher in June. If this were 2009, chances are that the stock would have gapped and kept on going.
But in today’s market, gaps are breakouts are failing close to 100% of the time. So, naturally, ORCL gapped and has gone nowhere in 60 days:
If you cannot trade options, then the best risk/reward entry is not the breakout, but rather closer to the gap-support area.
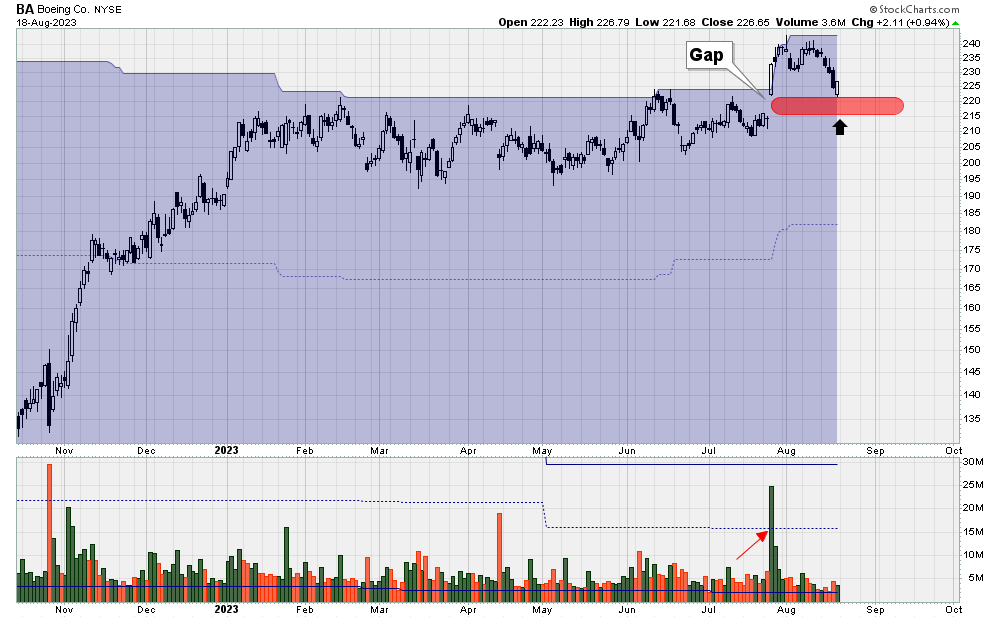
Similarly, I previously mentioned that BA was unlikely to actually trend higher after hitting a new 52-week-high last month.
Lo and behold, Boeing stalled out, like clockwork:
The best risk/reward buy-point is, once again, closer to the gap support area.
Likewise, CAT is approaching its gap-support area as well. The premise of the trade is that the support level at $265 will hold, so that is the logical stop-loss area: if price closes below this critical level, then I’d sell and move on to the next trade:
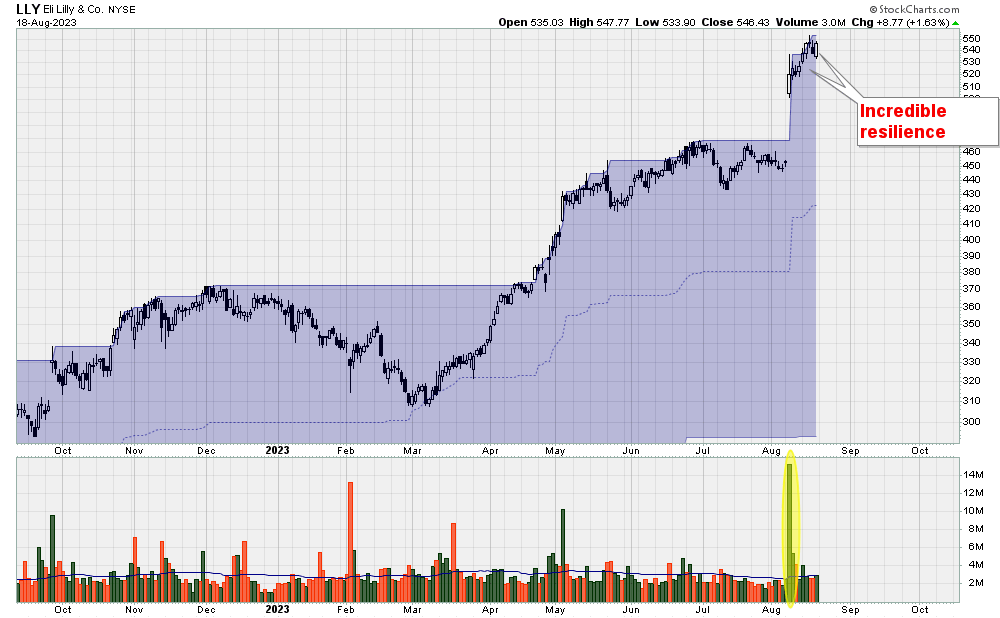
Next, probably one of the best looking charts out there today is LLY. Notice that even though the general market took a big hit, the stock barely budged.
The gap in LLY is very strong and, in my opinion, odds favour that the gap will continue to hold as support.
Gaps provide an edge, but an edge just puts the probabilities slightly in your favour. Anything can happen.
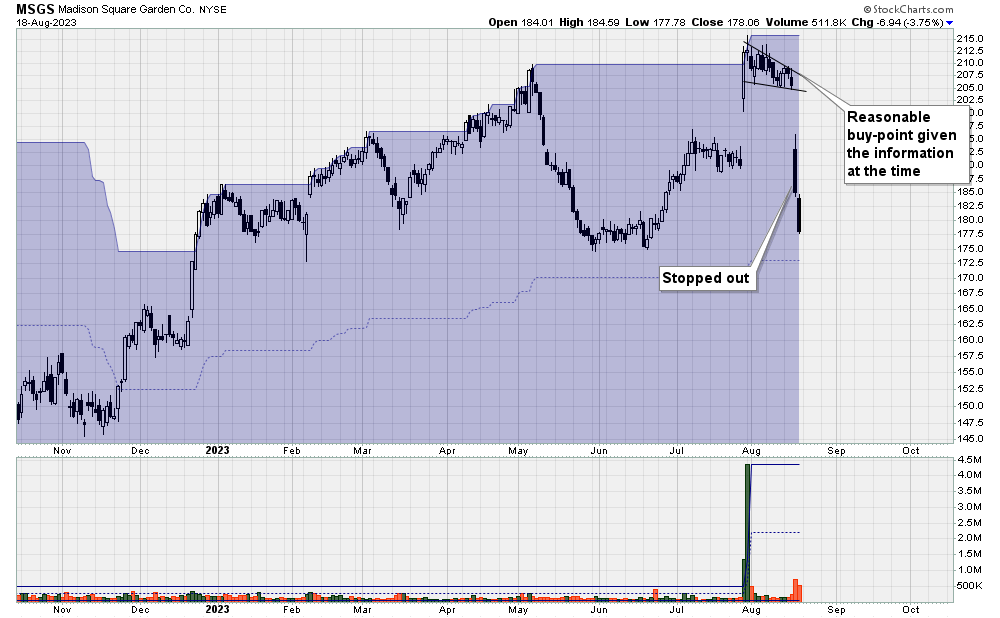
For instance, MSGS gapped higher recently. Based on the information available at the time, the chart appeared strong.
After forming a bullish pennant, I would have felt completely comfortable either buying the stock, or writing a put.
Anything can happen, though, and something did happen this week. The stock gapped down severely, forcing me to exit the trade at a loss.
Reflecting back on this stock, I genuinely believe it was a good trade. Sometimes good trades have bad outcomes.
Interesting ETFs:
Given the particularly treacherous price action this week, it’s a good time to remember that you don’t always have to trade.
And never in a generation has not trading and being in cash been more lucrative.
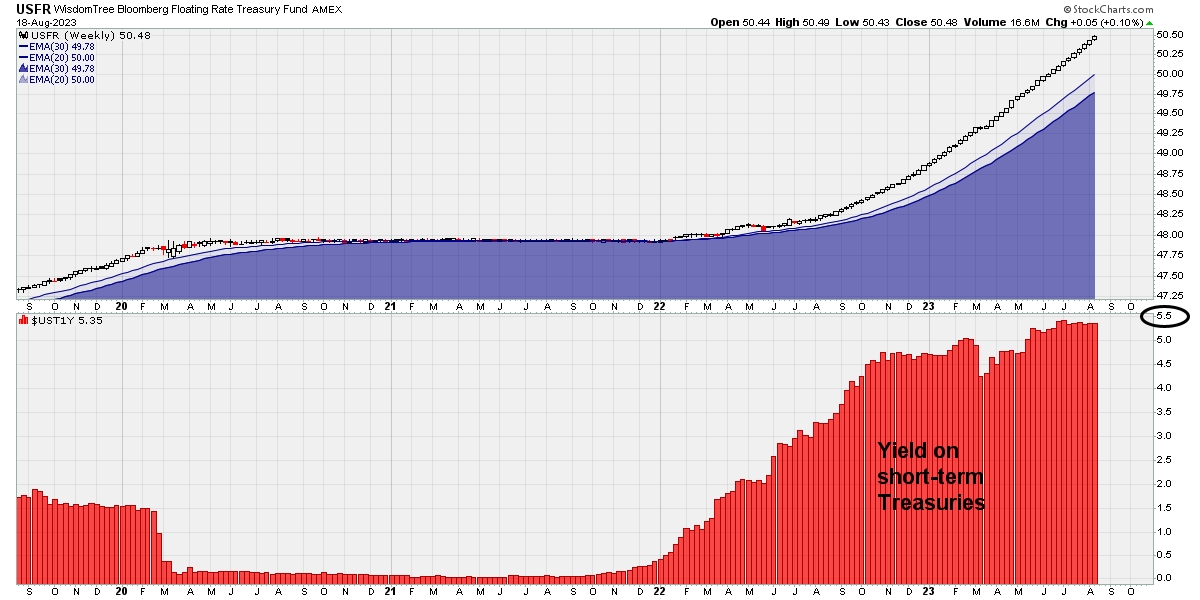
With yields on their way to 6%, funds such as USFR, TFLO and PSU/U.TO offer patient investors a highly attractive monthly yield:
At current yields, a $100,000 investment in USFR will provide you with a monthly interest payment of $460.
The conservative and traditional approach would be to take that dividend and reinvest it into more shares.
A potentially more lucrative (and certainly more interesting) method would be to implement Nassim Taleb’s bar-bell strategy. If you’re newer to the newsletter be sure to check out issue #91 where I explained the strategy in detail.
Switching gears, let’s delve into a strategy that I haven’t discussed before.
If you’re a serious student of the market, you are no doubt familiar with the Turtle Trading legend, first described in Market Wizards by Jack Schwager.
As later described in The Complete Turtle Trader by Michael Covel (see issue #111), one of the most successful amongst the Turtles was a man named Jerry Parker.
Amazingly, this man - the legend - has recently taken his strategy, a strategy that has been in development for 40 years - and wrapped it up into a convenient and easy to trade ETF.
Based on listening to hundreds of hours of Jerry Parker speaking on the Top Traders Unplugged podcast (recommended) I will now outline my best understanding of the strategy.


