

Newsletter of Danny Merkel - Issue #106

Market Review:
The good news is that there’s a tremendous amount of strength throughout the market. The bad news is that almost all of this strength is occurring in long-term downtrends.
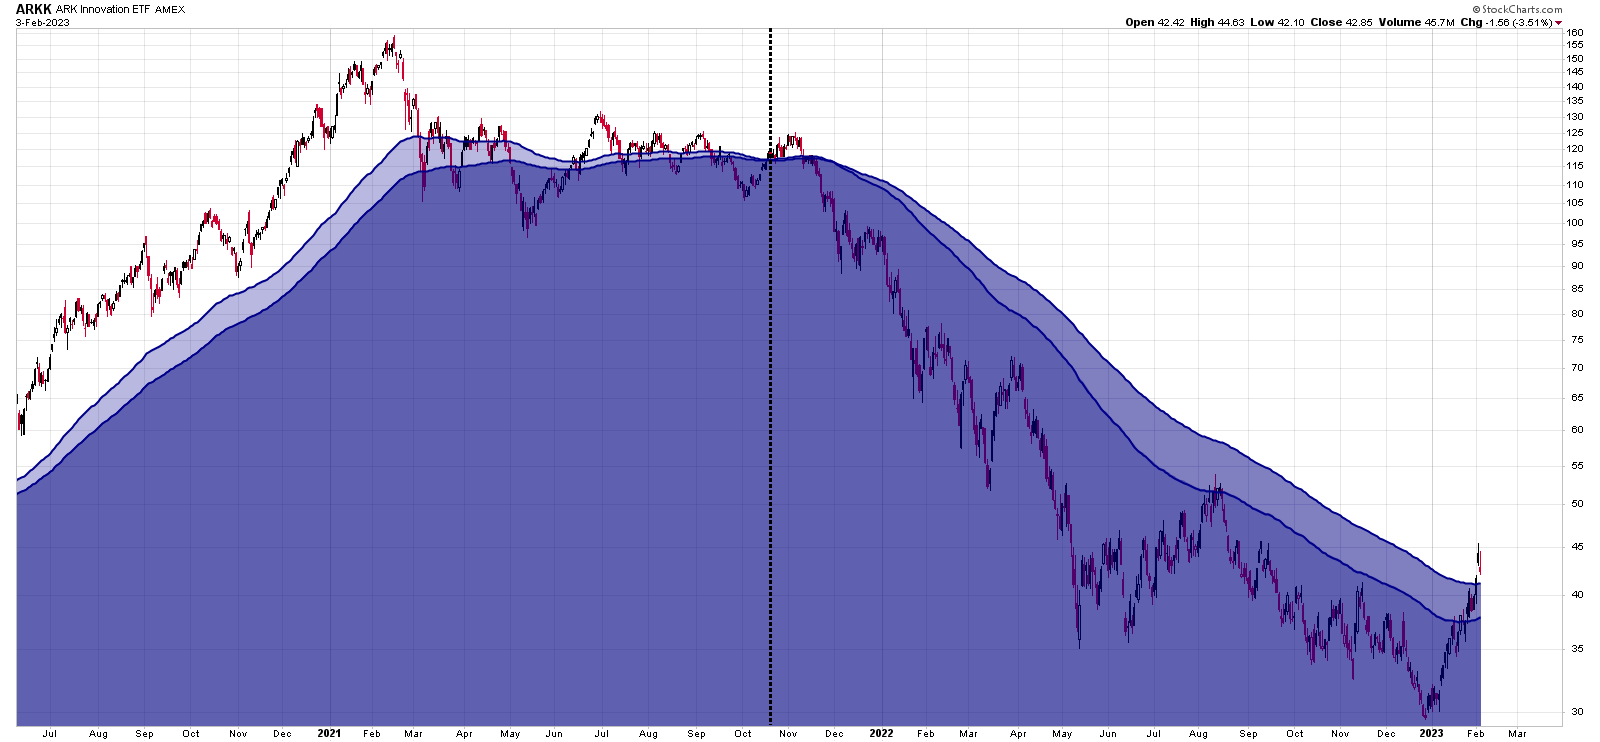
A quintessential example of this involves ARKK, an ETF that has soared 37.16% year-to-date. However, as impressive as this strength may seem, the long-term trend remains down.
The following chart is very simple. It illustrates ARKK along with just two moving averages: the 100 & 150ema.
By using such a long-term perspective, all of the noise is eliminated and what remains is a clear, clean, quiet trend.
But, you may be thinking, why not just participate in this current rally? You’re a trend follower, and the market is moving higher right now, so why not get a piece of that action?
My answer in two words: overhead resistance.
To visualize what I mean, below is a monthly chart of ARKK going all the way back to the day the ETF first started trading.
Back in April of 2020, price was at about $40 - the same price as today. Despite the price being the same, however, the potential back then was much greater than today due to this key concept of overhead resistance.

The difference back in April 2020 is that when the rally started, price soon broke into all-time-high territory. This means that every single person who was long was making money.
On the other hand, the situation today is radically different. You see, as ARKK fell last year, there were millions of amateur retail traders buying dips all the way down.
Because new traders will do whatever it takes to be “right”, they’ll typically never cut a loss and stubbornly wait until they can get out at breakeven.
In other words, if you randomly pick any price higher in ARKK say, $45.37, you can bet there is some retail trader out there with that exact average price who is just itching to sell at that price just so that he can avoid ever thinking he was wrong on the trade.
When you take this example and multiply it by the millions of other retail traders looking to get out at breakeven then that amounts to a major headwind.
Therefore, although ARKK is at the same price today as it was in April 2020, the profit potential is not the same.
For this reason, my focus is on stocks trading near all-time-highs so that there is no overhead resistance bogging down the trend.
Interesting ETFs:
I mentioned previously that it’s the most beaten down stocks that are powering this rally. Each day it seems, a new batch of heavily shorted names explode higher in a feeding frenzy of short-covering.
Conversely, the previously best-performing stocks are now the ones showing the most weakness.
If you took all of the best performing stocks of last year and wrapped them up into an ETF, you’d get something like MTUM, a fund that does exactly that.
Curiously, while ARKK was up close to 40% YTD, the best performing stocks of last year, as expressed through MTUM, are actually still down YTD.
As this monthly chart shows, the last three bars are red, which means that December, January and February (so far) have all been down months:

This weakness in the best performing names (such as FSLR, MRK, NINE & LLY) translates into a headwind for breakout trading in general and has presented a major challenge to my trading strategy in particular.
Individual Stocks:
Perhaps you’ve heard of a company from India called Adani Enterprises collapsing this week.
I’ve never heard of them until now, and I don’t trade Indian stocks, but I find it interesting to see how my strategy would have handled the situation.
Firstly, my strategy in a nutshell is to buy 52-week-highs and sell the position when the 20 day moving average is broken.
With these rules in mind, we can see that the ideal buy point occurred in mid-July when price broke above the upper blue channel, indicating a new 52-week-high:

Going forward, the trade would have been held until eventually price fell below the 20ema (thin red line).
A new buy signal was subsequently triggered in early November, but that didn’t amount to much as price once again dipped below the 20ema.
From there, zero new 52-week-highs were reached, so there was no reason to re-enter, and that’s a good thing given that things really started getting hot and heavy from that point on.
So once again the 20-day-rule would have kept you out of major trouble. But why does the 20ema work so well?
The answer is that it does a reasonable job of defining momentum based on my timeframe. But there is actually nothing special about the number 20. For example, Marty Schwartz uses a 10ema since that works for him based on his (shorter) timeframe.
In his captivating book “Pit Bull”, Schwartz expounds on his 10-day-rule:
The 10 day exponential moving average (EMA) is my favorite indicator to determine the major trend. I call this "red light, green light" because it is imperative in trading to remain on the correct side of a moving average to give ourself the best probability of success.
When you are trading above the 10 day, you have the green light, the market is in positive mode and you should be thinking buy. Conversely, trading below the average is a red light. The market is in a negative mode and you should be thinking sell.
Whether you use a 10, 20, 50, or 200 day line is more of matter of what timeframe is right for you. But the commonality is that all of these options will force you to exit losing trades in an objective and systematic way.
That’s important because human nature makes it difficult to cut out a losing trade. Quite simply, people want to be right, and selling a stock at a loss proves that you’re wrong. Your ego doesn’t like that.
So rather than admitting defeat, most people will look for evidence that confirms their original view point.
Here’s a cool psychological experiment that was performed years ago that illustrates what I mean.
In this experiment, a psychologist presents a man with a string of numbers: 2, 4, 6… and asks him to guess the pattern. He can ask the psychologist questions in order to help him deduce the pattern. The conversation goes something like this:
Man: 12, 14, 16?
Psychologist: Yes, that matches the pattern
Man: Okay, how about 64, 66, 68?
Psychologist: Yes, that also matches the pattern
Man: Alright, I knew it along, it’s got to be even numbers increasing by two
Psychologist: No, that’s incorrect
Man: Well, what is it then?
Psychologist: The pattern was any increasing sequence of numbers
So what happened here is that the man thought of a theory (increasing by two), but then only asked questions trying to confirm what he thought. At no point did he try to disconfirm his idea. He could have, for example, tried 7, 8, 9.
And the exact same thing happens in trading. People establish a theory in their mind such as Bitcoin/Gamestop/AMC to the moon and then spend all their time looking for evidence to support their view.
A professional trader does the opposite. Always keep in mind that “you might be wrong”. The 20-day-rule does that systematically.
Performance Review:
Before I discuss my current portfolio, I’d like to try something new and play an audio clip.
I love listening to Audiobooks and recently came across a clip that ties everything I’ve said today together.
The clip below is from Jack Schwager’s essential book “Hedge Fund Market Wizards” where he interviews Colm O’Shea: