

Newsletter of Danny Merkel - Issue #145

Market Review:
The past 30 days have been wonderful for retail traders but, as I’ll document in great detail today, this remains an extremely challenging environment for Trend Followers.
Retail traders got a big boost this month thanks to strength in small caps. Bigger picture, though, this strength doesn’t change the fact that the index remains stuck in an incredibly complicated trading range:

From a purely Trend-Following point of view, this chart is an absolute nightmare to trade. With each and every signal leading to losses, one could actually do quite well fading it.
In order to reduce whipsaws, it helps to take a longer-term approach. By focusing on buying just 52-week-highs, you could safely avoid all of the aforementioned buy signals.
However, even waiting for a 52-week-high can lead to whipsaws as well.
For example, the iShares Russell 2000 Growth ETF started printing new highs in July. Yet that was, in hindsight, the most dangerous time to get on board:
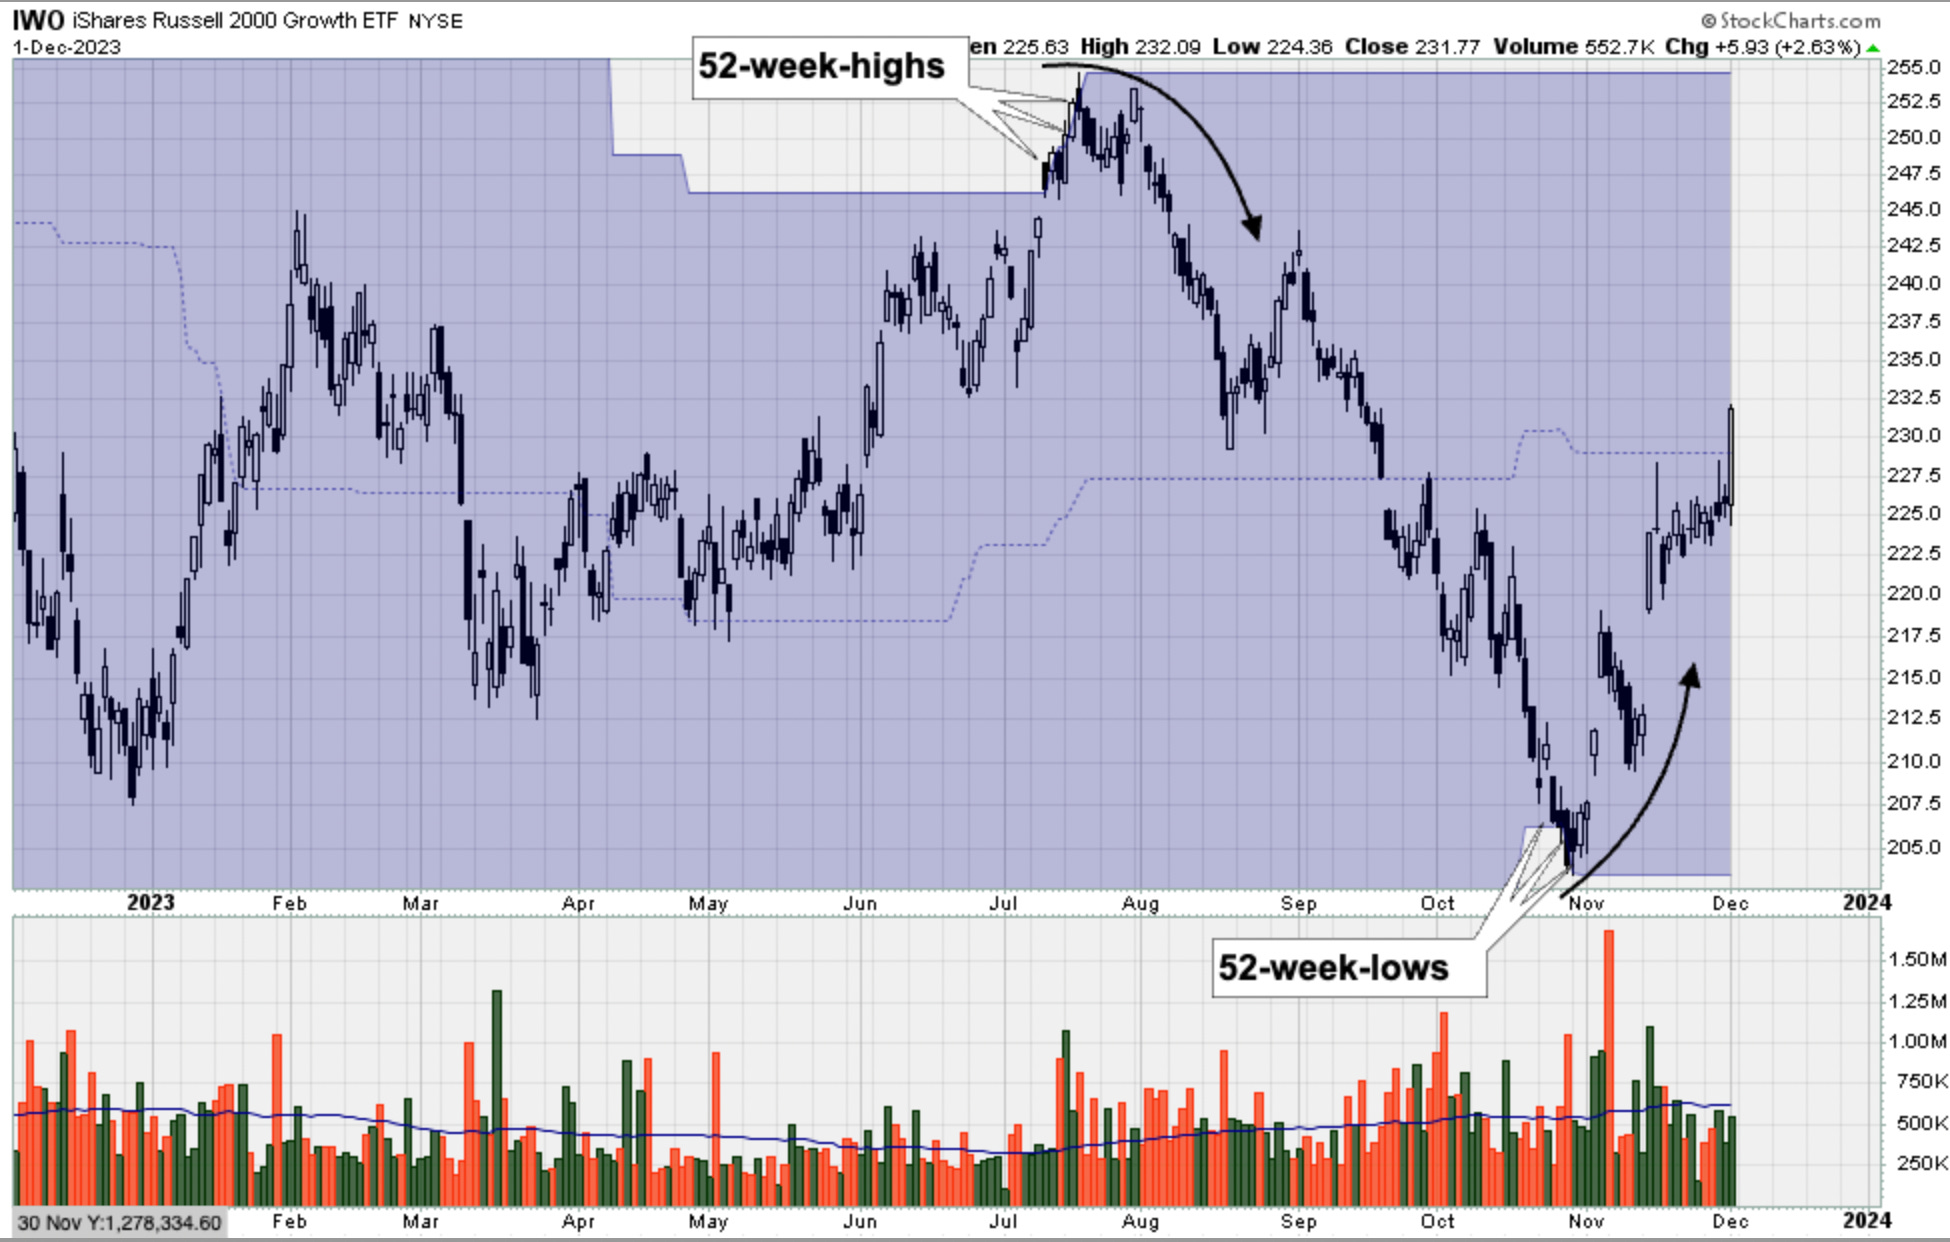
Then in late October, this ETF started making new 52-week-lows, but that ended up being a timely buy signal. Once again, doing the opposite proved most profitable.
Throughout the entire year, Momentum has been very slippery, very hard to latch on to.
This is evidenced by the iShares Momentum Factor ETF (MTUM), which has been trading in a range for the past 18 months:
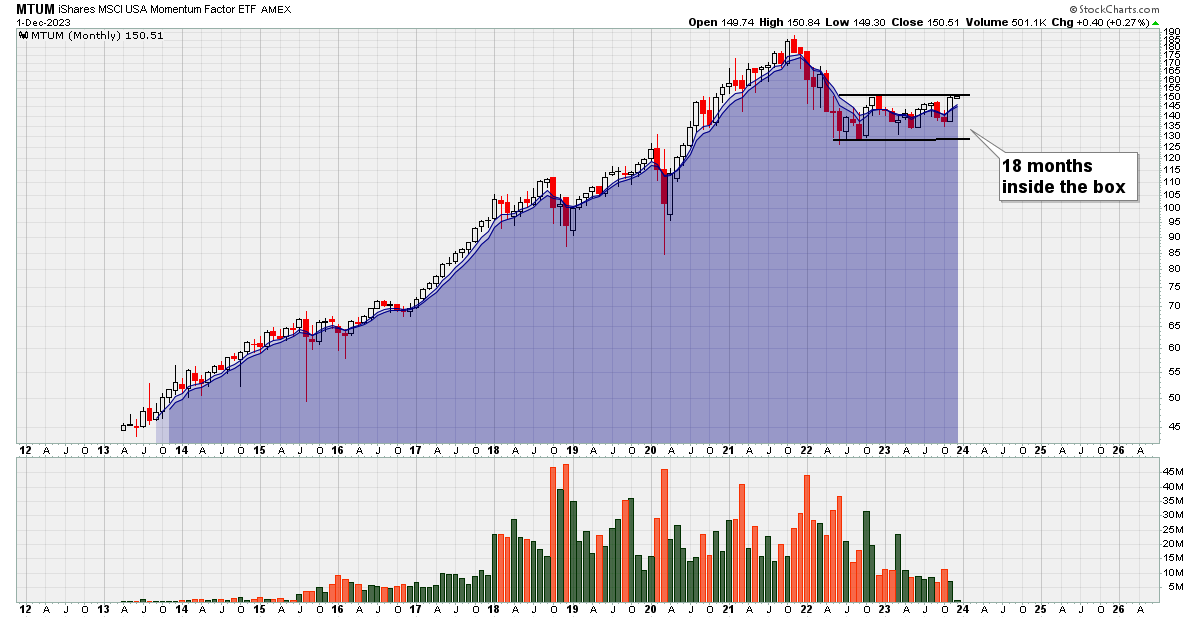
The fact that you have a tremendous amount of strength in other ETFs (such as QQQ), yet so little participation in MTUM is unusual.
Perhaps, you may be thinking, MTUM is a poorly constructed fund and that an experienced Momentum trader should be doing much better. Speaking personally, my stock picks have been underperforming the market, and I also pointed out that another veteran trader, Stephen Stewart, also appears to be challenged.
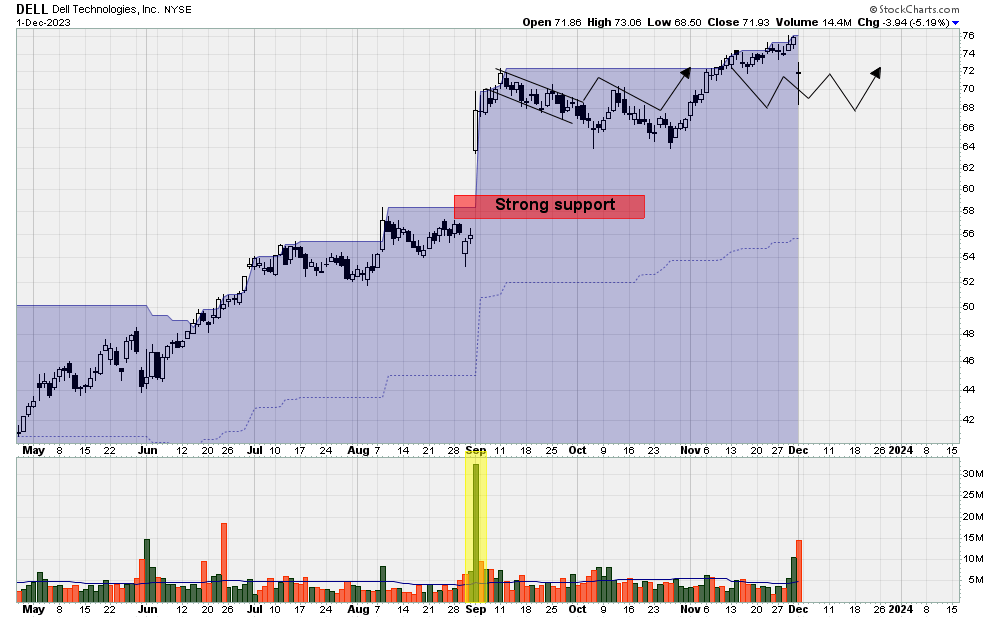
For instance, we both identified DELL as a buy candidate yet, just as a suspected, the stock simply cannot gain any traction:
Stephen Stewart and I have combined experience of 36 years of momentum trading, yet there is another trader that I admire that has even more than this: Nick Radge.
It’s always easy for me to remember how many years Nick Radge has been trading due to the fact that he started his career the year I was born - 1985.
So surely, with 38 years of trading under his belt, Radge’s performance must be helping him overcome these challenges, right?
Similar the MTUM, the reality is that even the most experienced trader I know of is having the same issues.
Have a look at his equity curve and, like MTUM, it’s also been stuck in a box for 18 months as well:
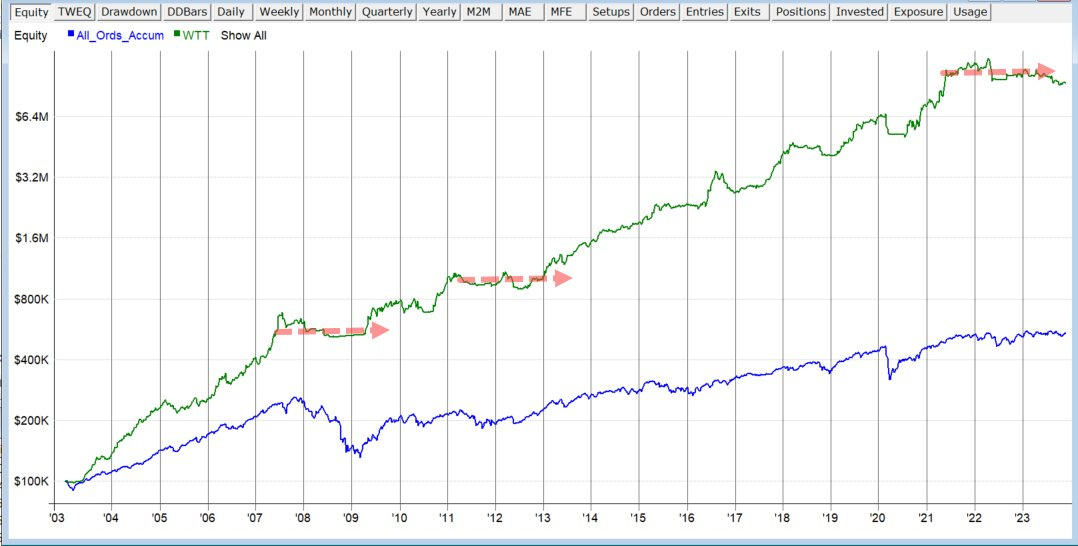
What is encouraging, however, is that Radge has faced similar challenging times twice before and has overcome these rough patches to achieve new highs.
Interesting ETFs:
In my opinion, the most fascinating new ETF this year is Jerry Parker’s TFPN. In case you missed it, I explained how this fund works in issue #130.
Jerry Parker was featured in Michael Covel’s great book The Complete Turtle Trader (see issue #111) and has 40 years of trading experience.
Though I do have great respect for Parker, as I mentioned previously, my expectations for this ETF were low.
And so far, TFPN has been meeting these low expectations:
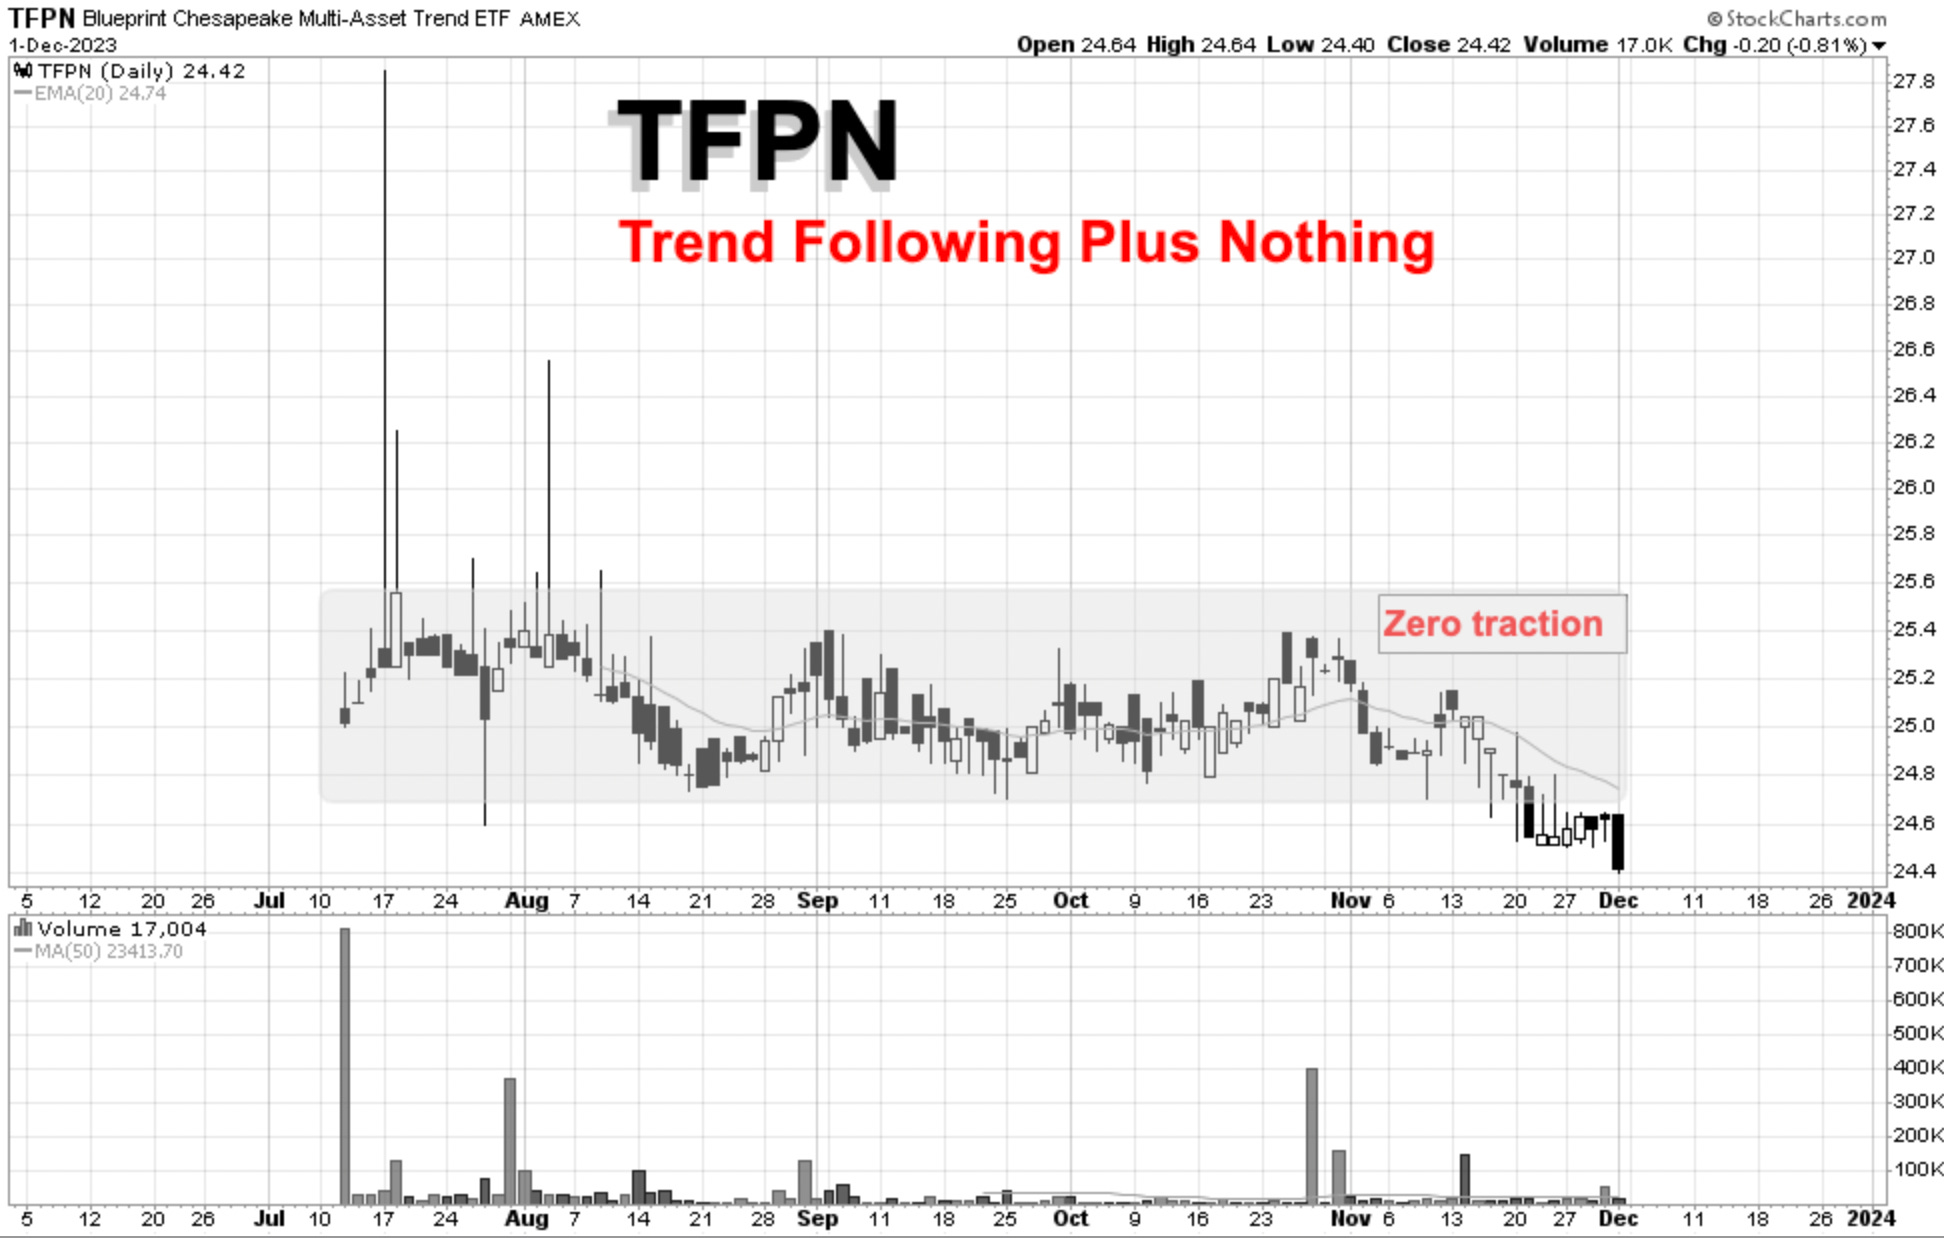
Similar to Radge, the fund cannot gain any traction and has been grinding sideways since day one. Though the fund is off to a lack-luster start, it’s important to remember that 5 months isn’t enough time to draw any meaningful conclusions.
What’s unique about this ETF is that it trades an incredibly diverse array of 300 different markets, both long and short.
In an interview with Parker, he even mentioned that he would be willing to trade Sunflower Seeds, which I took as a facetious comment - I didn’t think that would be even possible but, lo and behold, if you review the fund’s holdings, you’ll find his Sunflower Seed position!
It’s quite possible that TFPN is the most truly diversified ETF in the world. The screenshot below highlights a small sample of the fund’s portfolio, and the array of different markets is astonishing from Corn to the Czech Koruna to Milk to Ethereum to Coffee…wow!
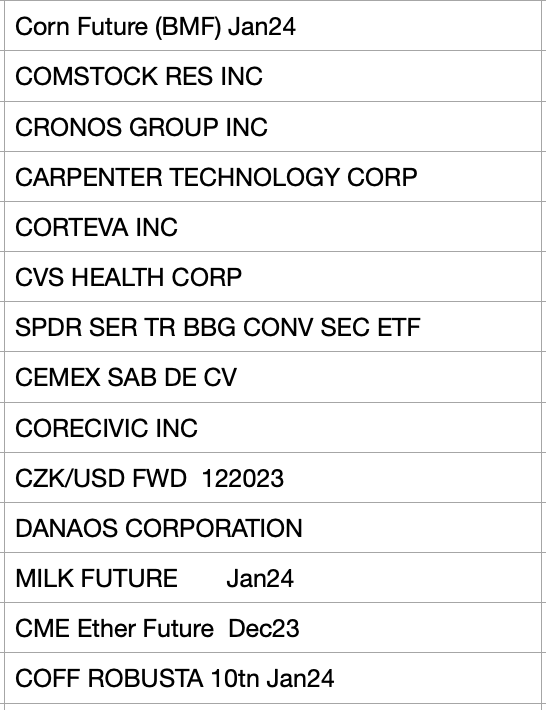
The funds’s 300 markets provides TFPN with a level of diversification that is incalculably greater than, for example, SPY’s 500 holdings.
Think of it this way, if the market gaps down 5% on Monday, you can be sure that almost every one of SPY’s 500 holdings will be in the red, whereas TFPN may or may not make money. If you’re long Ethereum and short Milk (in addition to 298 other markets) there’s no way of knowing how that would react to a market crash.
I could easily put all my net-worth in TFPN and sleep soundly at night. The average growth stock trader, with his portfolio of 8 tech stocks, on the other hand, absolutely not.
Sentiment Review:
VIX Analysis:
This next chart is new and highly experimental. I like to tinker around with different ideas, but that doesn’t mean I immediately start using these ideas as part of my system. In other words…
Okay, so this chart divides the short-term version of the VIX into a long-term version of the VIX. Then we take the RSI of that resulting ratio and that’s what appears in purple here:
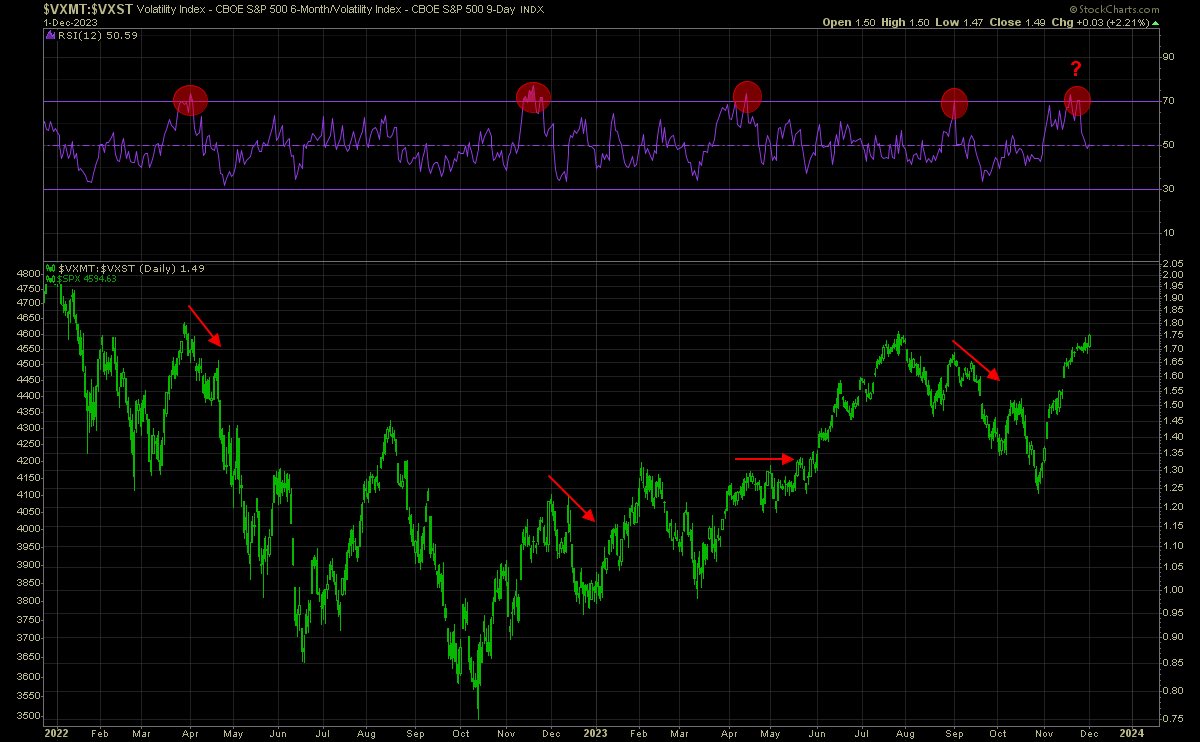
The bottom panel shows the S&P 500, and whenever this ratio becomes “overheated” it tends to result in a pull-back in the market or - at best - a pause. Either way, these zones have not been a great place to buy.
Looking at the pure VIX, it has also been hovering near oversold territory:
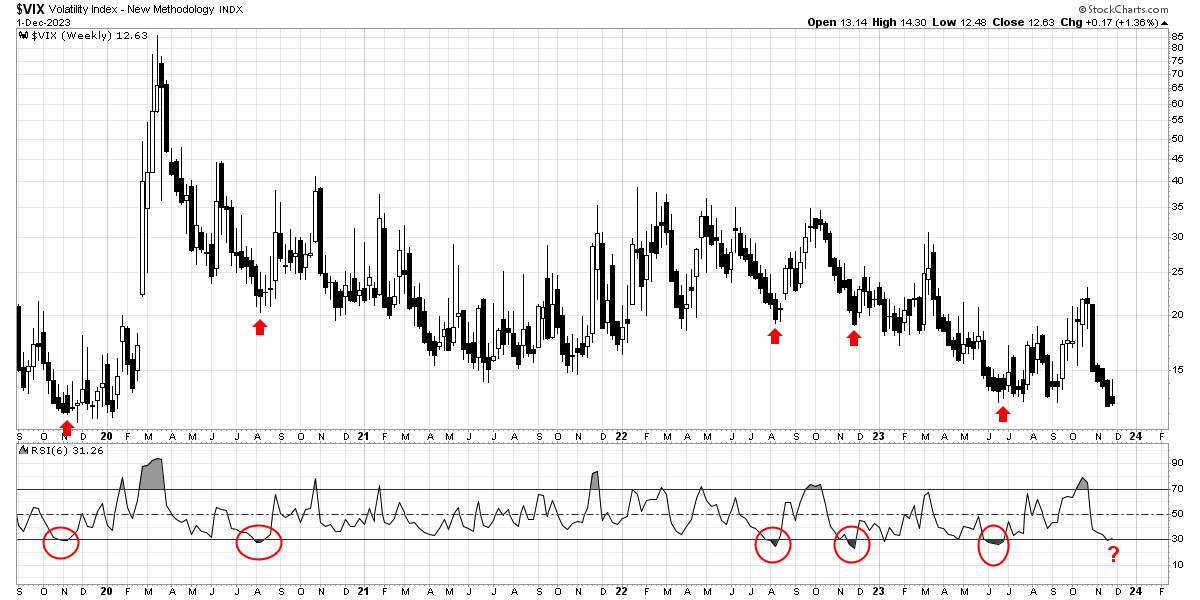
Curiously, the VIX rose in tandem with the market this week. In my experience, that is often a red flag.