
Newsletter of Danny Merkel - Issue #108
Newsletter of Danny Merkel - Issue #108

Market Review:
Most market indexes just chopped around this week, but within that chop one interesting observation I can make is that the S&P 500 has stalled out at a gap resistance zone:
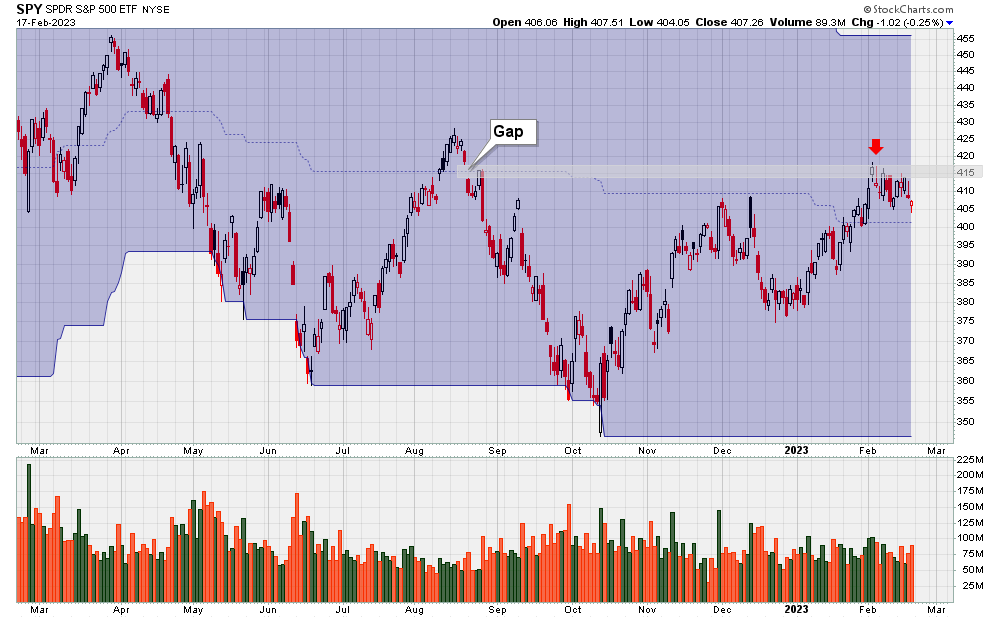
To me, gaps are incredibly important and something I always pay close attention to.
The rationale here is that when SPY gapped down in August and subsequently slid lower into October it resulted in a lot of traders accumulating losses.
Rather than admitting to a mistake, most people will wait until they can get out at breakeven in order to protect their ego and avoid the humiliation of locking in a loss.
Now as price recently rebounded back to the August gap area, these same traders finally had the chance to exit at breakeven and enjoy the satisfaction of being right, causing the resistance we’re seeing currently.
Anyway, I always put the odds in my favour by avoiding any prior gap down areas. The easiest way to do that is to focus on new 52-week-highs.
As explained previously, the blue channel above demarcates the 52-week-high and 52-week-low. At this moment, the S&P 500 is almost exactly in the middle, indicating that the bulls and bears are at equal strength.
Another observation is that SPY traded at a price of $405 in Friday. What’s so special about $405? I’m not sure there’s anything special about that number, but one weird tendency is for SPY to keep trading through that number over and over again.
For example, do you notice a pattern?
Price of SPY 3 months ago: $405
Price of SPY 6 months ago: $405
Price of SPY 8 months ago: $405
Price of SPY 10 months ago: $405
Price of SPY 12 months ago: $405
Price of SPY 22 months ago: $405
My point is that this isn’t bull market behaviour. In a bull market, prices go up over time and that simply isn’t happening today.
Another clue that this isn’t a normal bull market comes from the Russell 2000.
In a powerful uptrend, you’d want to see the RSI become overbought and then stay overbought. That would be a sign of strength.
However, what is actually happening is that the moment the RSI touches overbought territory, the bulls get whacked and price gets slammed down:
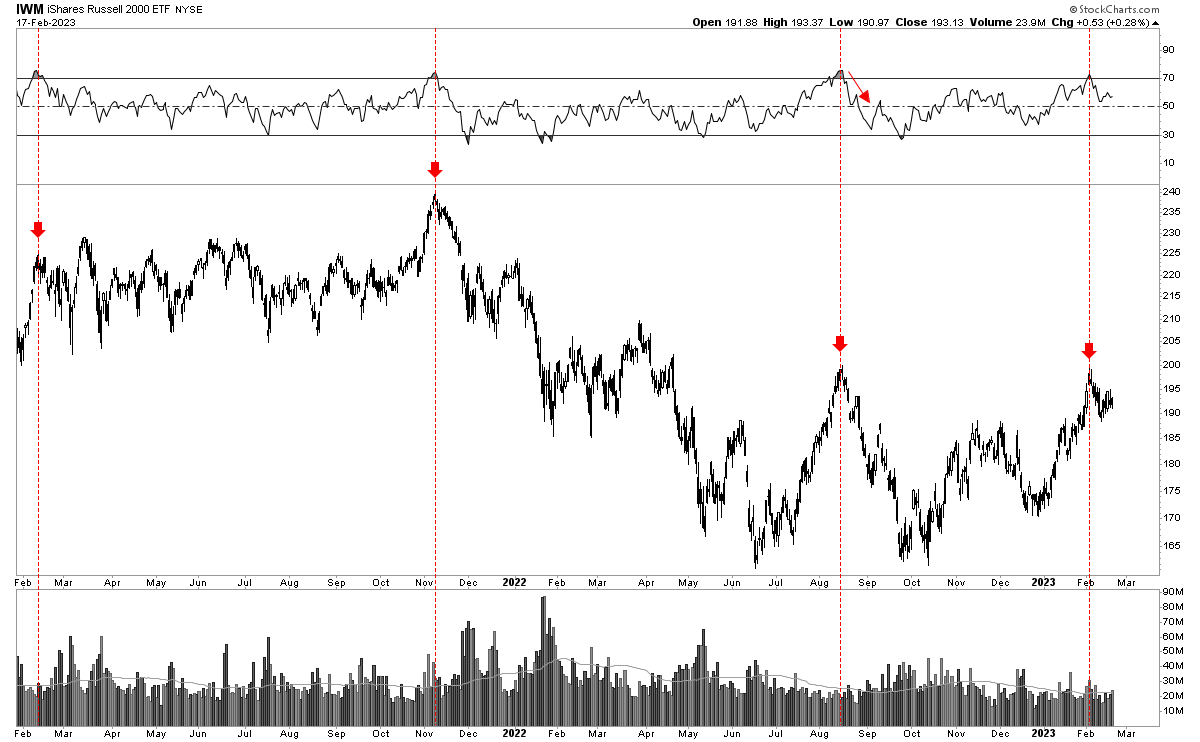
Referring to the above chart, there is absolutely nothing that indicates a bull market. Granted, the evidence for a bear market has also dried up, so what remains is a high volatility trading range - the toughest market type for trend following traders.
To provide contrast, compare the above chart of the Russell 2000 to the market in the mid-1990s.
Notice how the index repeatedly becomes overbought and stays overbought:

Notice, also, that this uptrend actually involved prices going up. In fact, the S&P 500 rose over 40% during a 2 year period. That’s a bull market.
On the other hand, the Russell 2000 is lower today than it was two years ago. You can call that a “confirmed uptrend” over and over again if you want, but it’s simply not reality.
The best solution to avoid getting entangled with a sloppy, trendless market is, once again, to focus on 52-week-highs or, better yet, all-time-highs.
Buying at an all-time-high is a powerful clue that something has changed and also ensures that there is no overhead resistance to bog down the trend.
As I’ve discussed previously, USFR is a perfect example of the type of move a new all-time-high can unleash.
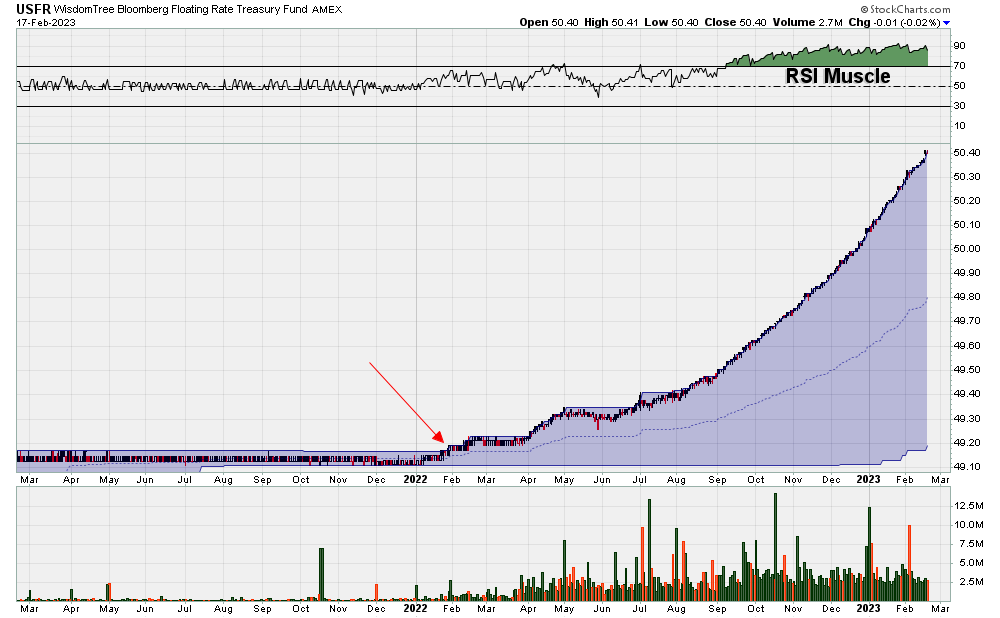
After printing a fresh new ATH in early 2022 (red arrow), USFR continued to cruise higher, which caused the RSI to become overbought. Yet, as is typical in a strong bull market, price just kept plowing higher. This is a common trait that all super-performance stocks have.
Logically, this means that if you sell just because price becomes overbought, you’ll never reap the benefits that a super-performing stock can have on your trading account.
But there is another fascinating angle regarding USFR that I’d like to delve into now. It’s no secret that ETFs like BIL, USFR, SGOV, and TFLO are all going up because interest rates are steadily moving higher.
Just this week, the interest rate on short-term US Treasury Bills reached 5% for the first time in 15 years, and this is something that will have massive implications for Trend Following firms.
Typically, a Trend Following money manager will only use a tiny fraction of their assets under management as a margin requirement for their positions. For example, let’s say that a money manager has $1 million in cash, they may only require 10% of that to actually hold down the futures contracts they’re invested in.
Now under a policy of zero interest, this huge chunk of cash earned nothing, which meant that the fund’s entire performance was dependent on the futures contracts held.
Today, however, that entire chunk of cash - $900,000 - can now earn passive income and at a rate of 5% that provides a $45,000 boost by the end of the year.
This means that a rate of return that would ordinarily be, say, 10% under ZIRP gets bumped up to 14.5% today.
Similarly, I know traders who have plenty of cash languishing in their brokerage accounts earning minimal interest. Be like a Trend Following money manager and ensure you are putting that money to work.
Individual Stocks:
Probably the most significant story this week involved the implosion of a stock called Credo Technology Group (CRDO).
Having been trading for the past 18 years, I’ve been smoked by my fair share of devastating gap downs, although I did manage to miss this one due to chance.
Trading is a tough business and moves like this are an unfortunate reality, but a stock like CRDO does provide some very important lessons.
Firstly, the quote in red is from Warren Buffett and something that I’ve disagreed with for reasons that should now be obvious:

Likewise, this example proves that stop losses alone won’t do much good. It doesn’t matter how diligently you enter your stops and it doesn’t matter how closely you watch your portfolio - a gap down can still always crush you.
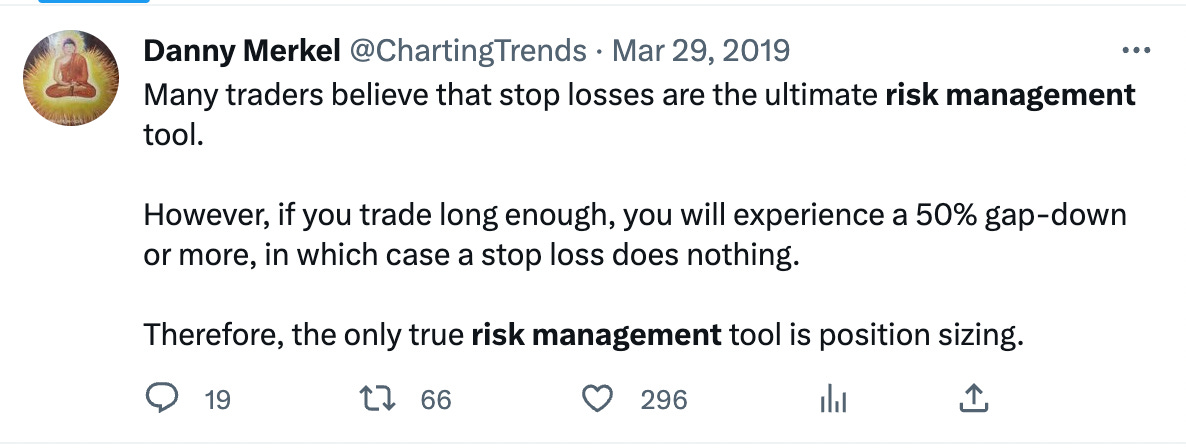
Your only defense against a gap down boils down to position sizing. If you went into the week long CRDO on margin then you ended the week with a blown up account.
Or if you went into the week using the position sizing strategy I explained last week (see Issue #107) then you got hurt, but not killed. You can keep trading.
But not everyone agrees, and I still see a lot of tweets along these lines on social media:

There are several logical fallacies that come to mind here. Firstly, you cannot just look at the hedge fund managers who used huge leverage and won - what about the losers? And happens when these winning managers repeat these big bets over 5 or 10 years?
Secondly, although it is true that some intelligent traders - such as George Soros - have a history of going for the jugular with outsized bets, the critical difference is that these were incredibly asymmetrical opportunities with a fixed and knowable downside, such as betting against a currency that is pegged by a government.
A recent example of this exact situation happened last year with the Sri Lankan Rupee.
At the time, I was living an extremely unorthodox life-style in “the jungle”, and I could clearly see signs that the economy was on the verge of collapse; I knew that the Rupee’s peg to the dollar was on thin ice.

With limited downside and the potential for the peg to rupture at any moment, this was the kind of asymmetric trade that Soros would “go for the jugular” on.
Importantly, however, these highly skewed situations come about rarely and certainly did not apply with respect to CRDO.
The bottomline is that when it comes to individual stocks, anything can happen and your only option for long-term survival is proper position sizing. Bet small or die.
Current Holdings:
Here are my holdings going into next week: