

Newsletter of Danny Merkel - Issue #113

Market Review:
The market continues to absorb a wide variety of seemingly significant news without budging.
You probably wouldn’t guess this from watching financial media, but for the month of March, so far, the S&P 500 is up 0.02%.
This lack of movement can be seen in the chart below, which appears to be absolutely gridlocked, in a state of zero trend:

Technically, the long-term trend remains down, but this stalemate has resulted in price and most moving averages converging onto a single point.
Beneath the surface of this log-jam, though, there are some interesting movements afoot.
On the one hand, you have the QQQ showing incredible relative strength. If you delve deeper into the Nasdaq, however, you will see that most of the components are falling apart:

Basically, the QQQ is being propped up by just a handful of mega-cap names, such as NVDA, MSFT and AAPL.
In other words, big stocks are doing well while smaller, more speculative, names are deteriorating.
This new trend has resulted in something quite unusual happening: the Nasdaq and the Russell 2000 have become inversely correlated:
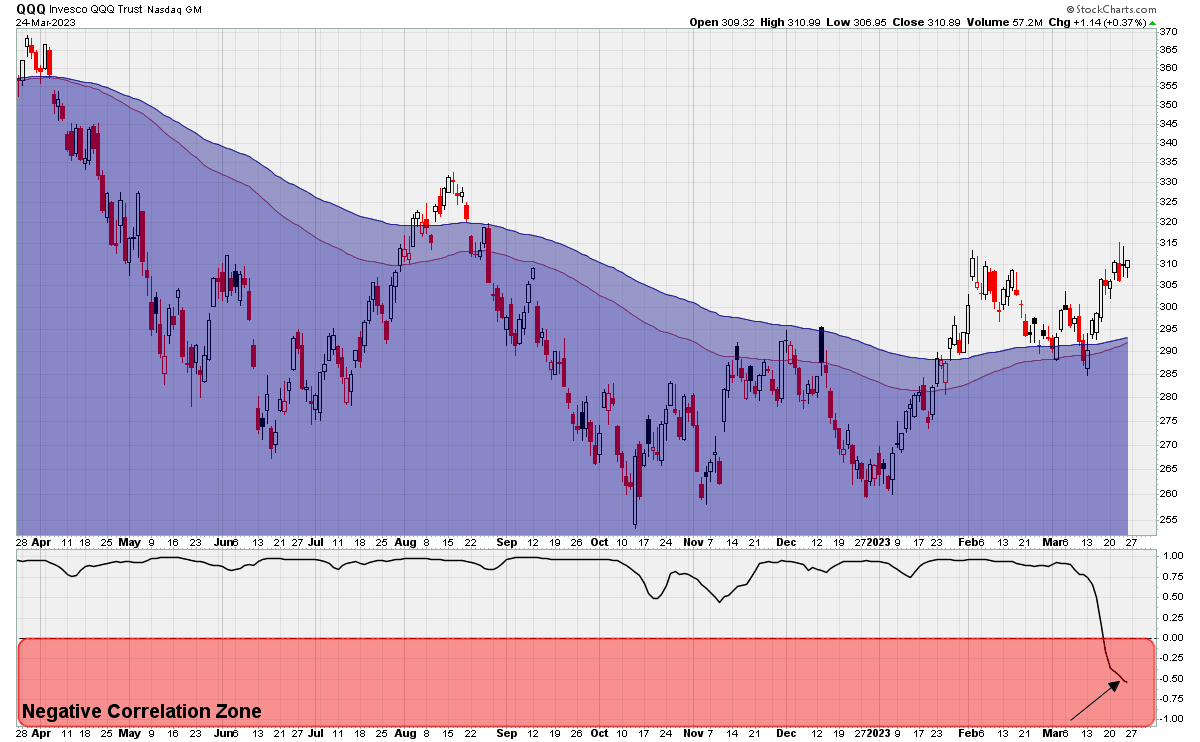
Normally, the big-tech laden QQQ and the small-cap Russell 2000 aren’t perfectly correlated to begin with, but a full-blown negative correlation is quite rare.
In fact, this is the strongest divergence in almost 5 years. When were these two indexes so strongly opposed previously?
You’d have to go all the way back to October 2018 to find a similar dichotomy. And it wasn’t good news for either index:

Trend Following Discussion:
I received two similar questions regarding whether the strategies described in books such as How to Make Money in Stocks or The Momentum Gap Method still work in today’s market.
My answer is that, yes, they absolutely can work today but only if the market type matches the method.
Many of the great traders that we all have learned from - ranging from William O’Neil to Mark Minervini to Dan Zanger - were written during the greatest bull market in history: the period between 1980 and 2000.
As this next chart shows, investing in stocks (i.e. the S&P 500) absolutely trounced everything else:
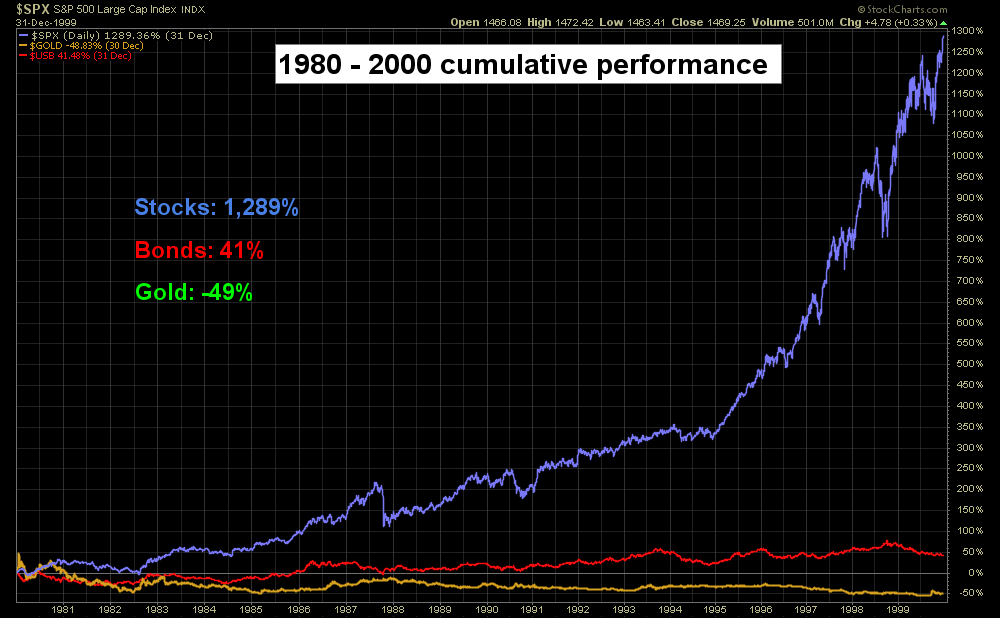
During this period of prosperity, it made sense to be 100% long-only. And forget about going short, or even diversifying into gold or any other market for the matter - stocks were the best game in town.
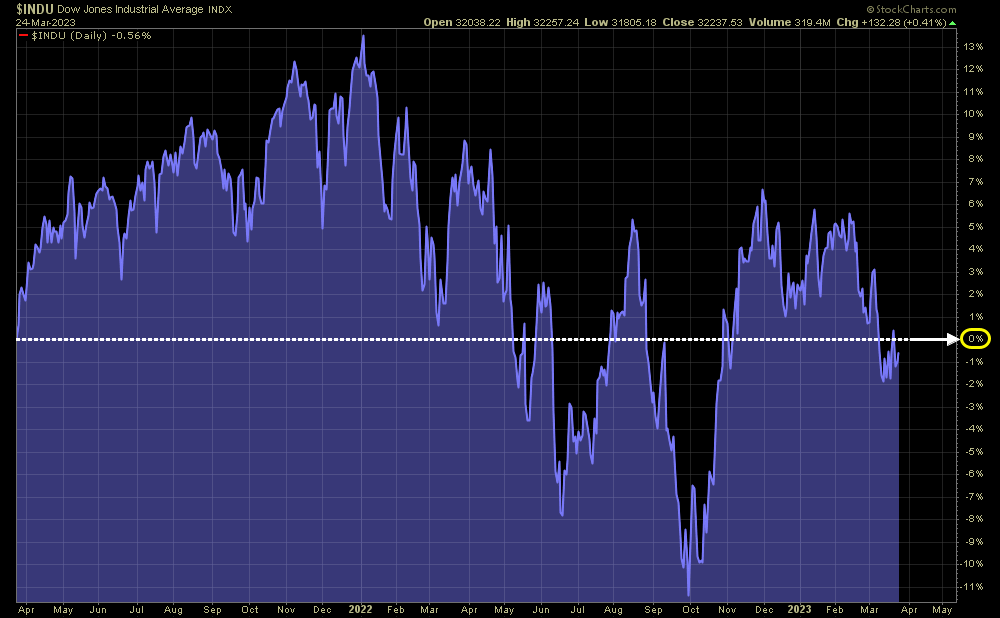
Fast forward to today, however, and the market type is radically different. Rather than constantly going up year after year the DJIA, for example, is profoundly stuck.
Here’s an interesting fact: the DJIA traded at 32,000 on Friday. It also traded at 32,000 on this day 2 years ago. Rising exactly zero percent over 24 months shows that we have a “stuck market”.
Perhaps a better example of this “stuck market” involves the Russell 2000. Amazingly, this index has returned exactly zero percent going back nearly six years.
Adding insult to injury, this zero percent rate of return doesn’t count the tremendous amount of inflation that has accrued. Think about your grocery bill back in 2018 compared to today and it’s clear that something ain’t quite right in America.

Now the problem I see today is that you have all of these new traders getting excited after reading William O’Neil and subscribing to IBD and then apply those techniques to today’s market.
What worked during the raging bull market of 1988 is simply not working in today’s weak, flaccid market.
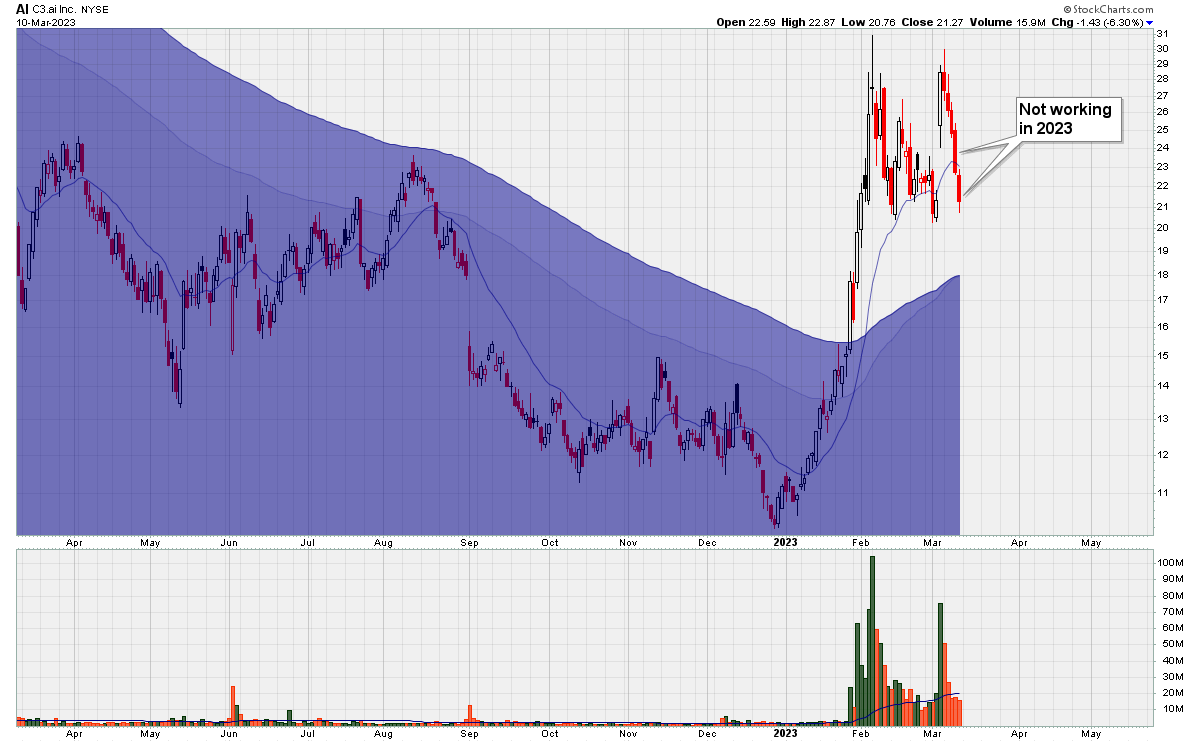
So there’s a huge mismatch between strategy and market type. Take for example this supposedly new leading stock - AI. Is this a bullish chart?
If you read any trading book (most likely written in 1980s) this is a good looking chart. It’s a new, dynamic industry. It gapped up on big volume. Institutions are getting on board. Everything is lined up, right?

This is the perfect chart pattern and it likely would have worked in the right market type. The trouble is - and what these IBD traders have a hard time understanding- that this isn’t a bull market.
Long-only momentum trading plus a bear market in growth stocks don’t mix well. So this was a chart-pattern that probably would have worked fantastically in 1995, but in today’s brain-dead market got absolutely wrecked.
Basically, momentum trading needs big movement to pay off. There were big movements in decades past, but at this moment, the market is stagnant.
Interestingly, big movement can occur in areas outside of the stock market, such as in the commodities markets.
Back in the 1970’s when the Momentum Gap Method was written, there were massive movements in Crude Oil that translated into opportunities in resource stocks as this next chart shows.

In conclusion, momentum trading isn’t working today due to the fact that the market type isn’t right.
If the market type changes, if the market gets its act together and forms a real uptrend, if we start seeing new 52-week-highs in the indexes again, then let’s see how momentum does.
Option Trading:
I sense that the vast majority of readers are not really onboard my strategy involving option writing.
But whether you like it or not, it is working in this current market type.
With an increase in volatility, options premiums are high. And with a completely deadlocked market, a lack of movement is resulting in countless millions worth of premiums expiring worthless each week.
Let’s examine a few more cases showing how the strategy works.