

Newsletter of Danny Merkel - Issue #143

Market Review:
The chart below uses a 200 and 250 day moving average to reveal the market’s ultra-long-term trend.
Going back to the year 1996, this ultra-long-term trend can be segmented into 7 unique eras:
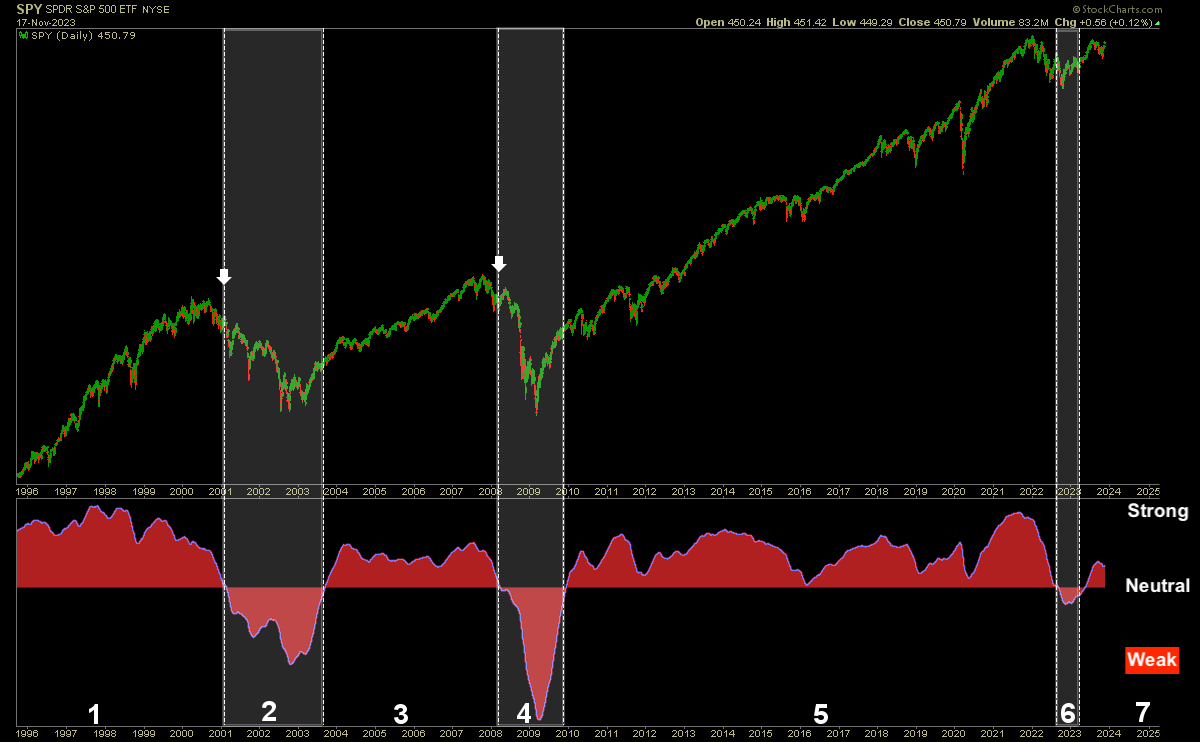
Area #1 shows a robust histogram, meaning that the long-term was strongly up. The mid-1990s were ideally suited for bullish strategies, such as momentum trading and even call buying.
Area #2 highlights the lengthly bear-market that occurred after the tech-bubble burst. Momentum trading become close to impossible for this 3 year period and if you study successful growth stock traders during this time, such as Mark Minervini, they completely stopped trading.
Area #3 displays the new bull-market starting in 2003. Notice how this new uptrend was never quite as strong as the previous boom.
Area #4 reveals that the GFC created a much deeper bear market, though not as prolonged as the tech bust.
Area #5 was the l…