

Newsletter of Danny Merkel - Issue #136

Market Review:
Another down week for the S&P 500, and with bearish sentiment rising, it’s probably a good time to discuss why I never recommend shorting the market.
First and foremost, SPY remains in a long-term uptrend, which I define using a 100 and 150 day moving average:

Like a heavy, lumbering pendulum, the trend swung higher in April and remains up today.
That being said, the index has put in a lower high, providing a clue to the observant short-term trader as well as forming a problematic gap down.
Overall, my view of the S&P 500 is neutral.
Like I’ve said before, being neutral isn’t going to get you much traction on social media or traditional media. Has CNBC ever brought on a guest who proclaimed he was neither bullish or bearish?
But being neutral is underrated. Sometimes the best approach is to wait patiently until either the bullish or bearish case proves itself.
For huge swathes of the US stock market, being neutral makes sense. For instance, consider the S&P 500 equal weight ETF:

Can you really blame someone for looking at the above chart and coming to a neutral opinion?
But perhaps this is just my opinion. Maybe there is a raging bull market in the above chart that I’m just not seeing.
Let’s shift from opinions to facts and consider how well the S&P 500 equal weight index is doing year-to-date.
The index is up 0.27% YTD. That’s a fact. Most stocks are in a high-volatility trading range covered in a thin veneer that consists of a handful of big-tech names.
Historical Charts:
I’m a big believer in studying market history, due to the fact that human nature never changes and chart patterns have a tendency of more or less repeating over and over again.
Rewinding the ARKK chart, we can see that price formed a suspiciously long consolidation pattern below all-time-highs.
Remember, the longer price grinds below ATH territory, the more dubious the bullish case becomes.
Strong bull markets are paved higher by new ATHs, and if a chart stops doing that for an extended period of time, something is wrong.
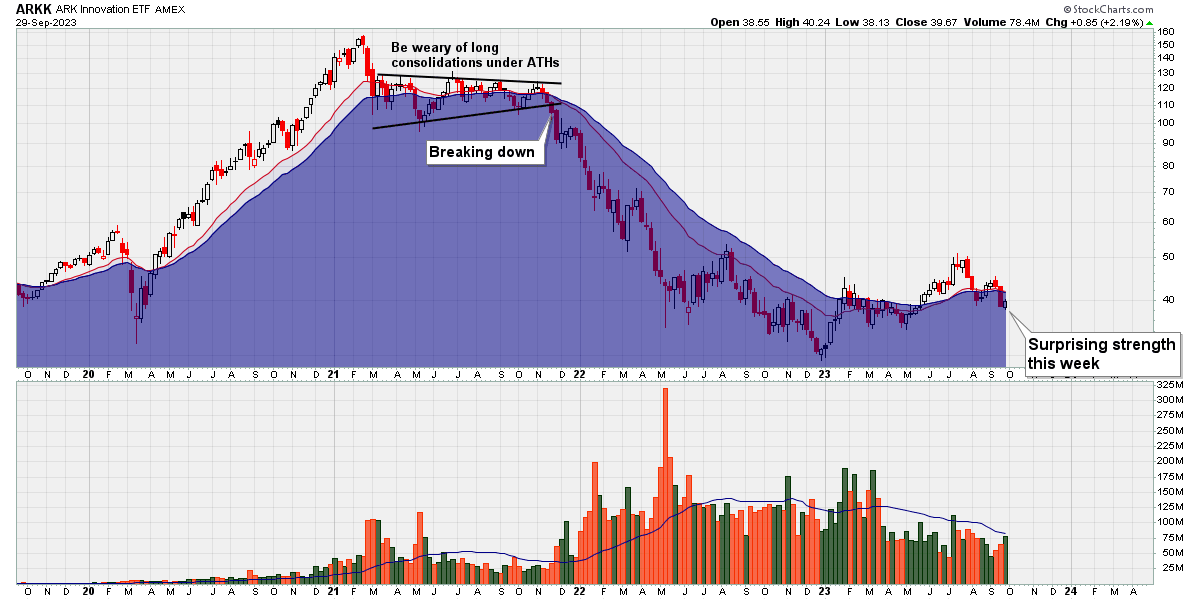
And something was very wrong with ARKK back in 2021. After grinding sideways for most of the year, the ETF broke down hard on huge volume.
The ensuing bear market obliterated countless new traders who refused to study market history, cut losses and manage risk.
Fast-forwarding to today, and that brutal bear market has ended, yet what has replaced it has been a complicated, high-volatility trading range - the toughest kind of market for me personally.
One fresh observation is how resilient ARKK was this week in the face of rising interest rates and an overall weak tape. This isn’t a buy signal for me, but it is a piece of disconfirming evidence that causes me some distress about my shorts.
Gold:
I mentioned two weeks ago that gold was “dead” so hopefully there was no confusion on where I stood on the yellow metal.
It’s worth repeating that a healthy bull-market is paved higher by new ATHs, so when gold hit new highs and repeatedly sold off (red arrows) that was a major clue that something was wrong:
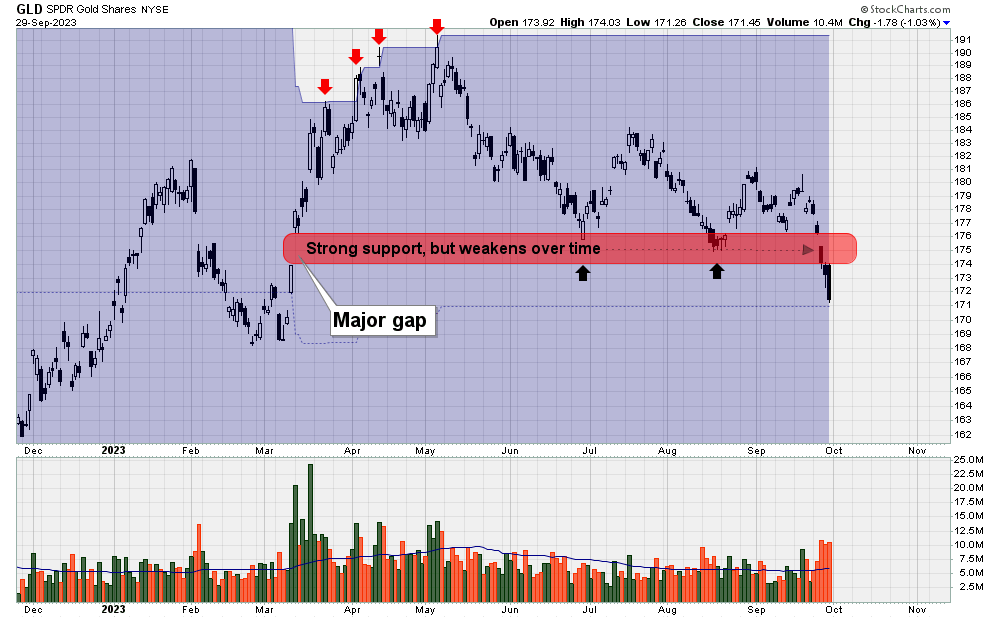
For the months of June, July, August and September, gold printed 0 new highs. That should be useful information to the perceptive trader.
The only redeeming quality of the gold chart was its ability to bounce off gap support. However, when it comes to gaps, support will tend to fade over time and - importantly - the more times support is tested, the more likely it is to fail.
Therefore, when gold started cascading down to gap-support - a gap that was already 7 months old - for a third time, I knew the situation was extremely precarious.
Silver:
Similarly, the price action of silver this week was horrendous.
A unique observation regarding SLV is that it printed a single, solitary 52-week-high in early May and then immediately pulled back (red arrow).
You see, if silver was really in strong hands, if big money was genuinely accumulating the metal, SLV would have printed another high… and another… and another.
The fact that it poked its head into new high territory and got whack-a-moled was also valuable information to the astute chartist:

Moving forward to today, we can see Friday’s nasty “piledriver candle”. This candle is particularly bearish since it shows the bulls gapping the stock higher, but then savagely getting smacked down, closing at the lows of the day.
I realize that I have a diverse audience who may not be familiar with the American wrestling move known as the “piledriver” so I have included the following educational GIF:

In all seriousness, though, great trading is largely about not getting killed. Play superior defense. Avoid getting pile-driven.