
Newsletter of Danny Merkel - Issue #149
Newsletter of Danny Merkel - Issue #149

Market Review:
A central theme is that the last two years have been challenging for Trend-Following stock traders, but that there are signs of improvement.
While the past two years have been strange, a lot of traders might not be able to put their finger on exactly why.
In my opinion, this whole rally has been weird since up until very recently, it never produced a single all-time-high.
This next chart highlights a two year “dead zone” in SPY that produced exactly zero new ATHs:
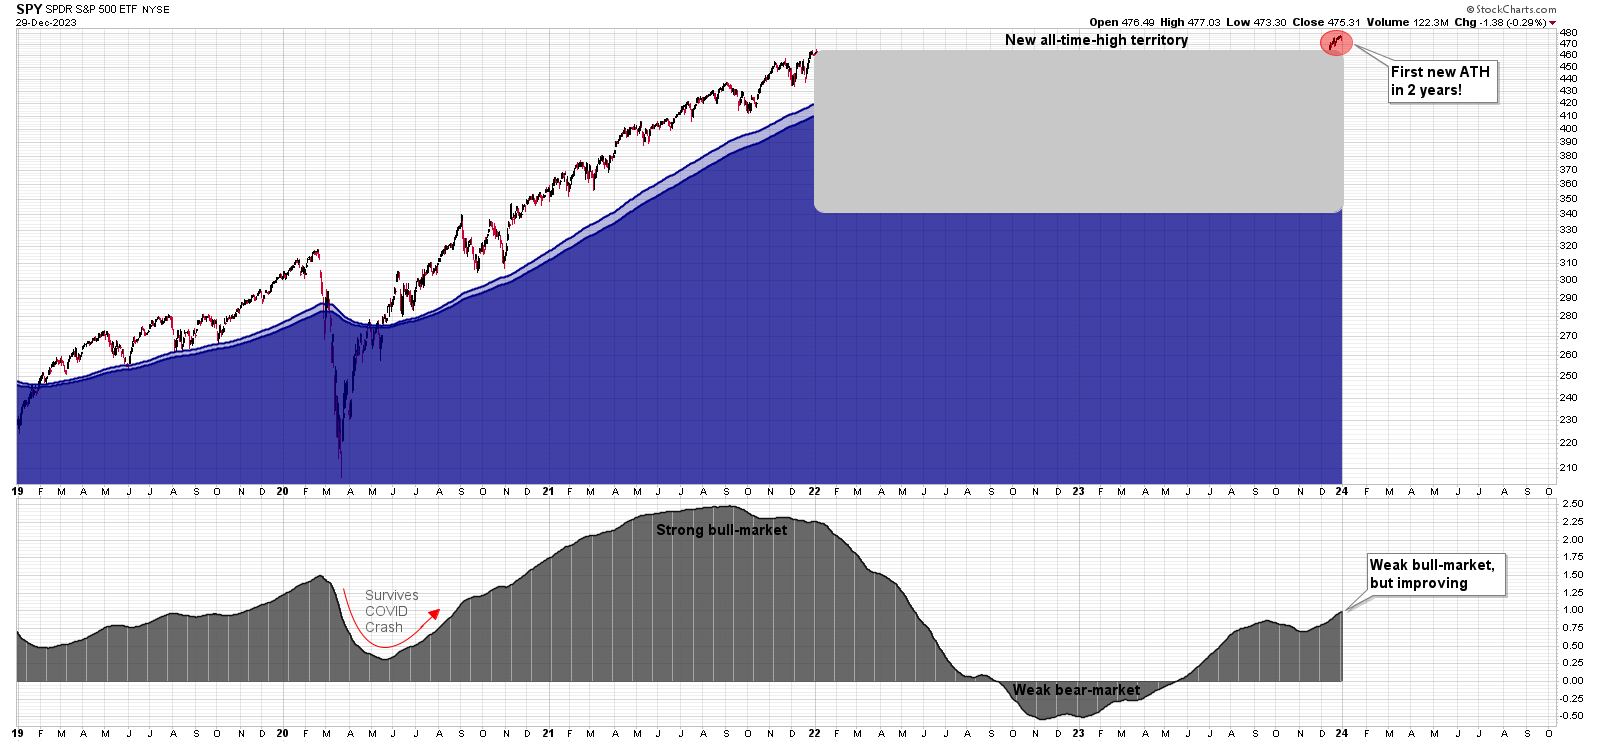
While this dead zone hasn’t been fantastic for momentum traders, the good news is that price has finally sprouted through to new high ground (red circle).
Secondly, the bottom panel shows the very long-term moving averages are still indicating a “weak” bull-market, but with gradual improvement.
If you were previously bearish on the market, I can sympathize with this view. There were thousands of stocks printing new lows just 6 weeks ago. However, if price makes a new ATH, you really need to force yourself to change your mind.
Every hypothesis needs to be falsifiable, and if you’re still bearish once price makes a new ATH, then when exactly do you change your mind - after 10 new highs? 50? 100?
All-time-highs are incredibly important to me. There is no clearer and more objective sign that something is in an uptrend than when it enters virgin territory.
Every major trend in market history - whether that be Microsoft, Amazon, Apple or Bitcoin - has been paved by new record highs.
Because fresh new highs are such a powerful signal, I’ve created a new charting style that has never been seen before in the history of technical analysis that shows new ATHs and only ATHs.
I doubt this charting style catches on, though, since it’s boring. The way it works is that when price makes a new ATH, the graph ratchets higher. It can never ratchet down. If price goes for an extended period of time without ever making a new ATH, then the chart just flatlines, which is exactly what QQQ has done for the past two years:
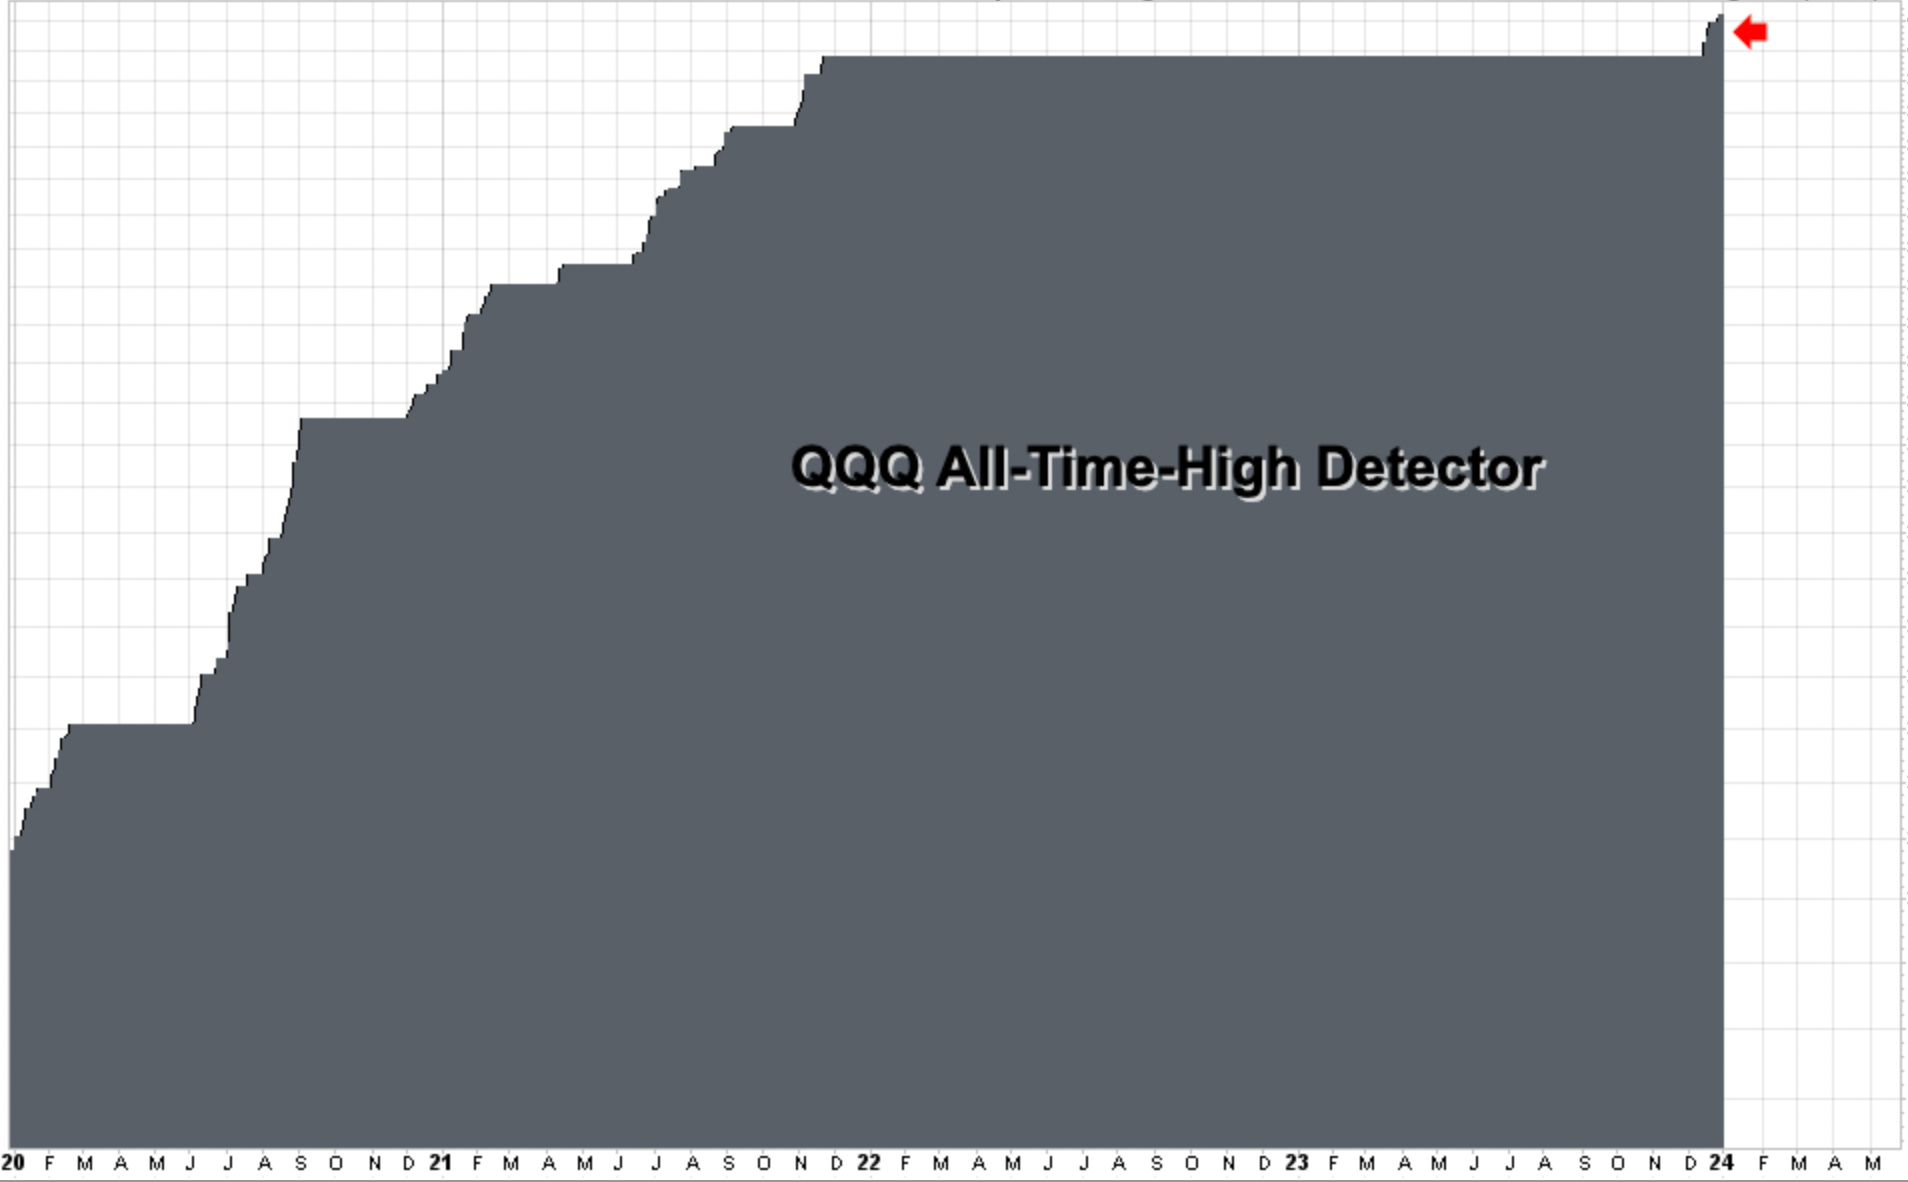
In my opinion, it is very significant that this flatlining has come to an end. The red arrow shows a new beginning.
Also, to clarify one slight nuance, SPY and QQQ are indeed making new ATHs, yet the S&P 500 and Nasdaq are not. This is because the ETFs include dividends, while the indices don’t.
The dividend yield for these ETFs isn’t huge, but it does add up over time as this next chart illustrates, which means that the race towards to new ATHs will always be won by SPY and not the S&P 500 itself.

This means that officially the S&P 500 recorded zero new ATHs for the year, circling back to what I mentioned at the start: this was an unusual rally.
As a general rule of thumb, the more new ATHs, the stronger the rally and the better it is for pure momentum traders. By this logical, years like 1995, 1999, 2013, and 2017 were great years, which they were.

With a grand total of zero new highs for the year, it’s really hard to justify the “raging bull-market” thesis; however, as I have argued, things are looking better going into 2024.
More Market Review:
Up until recently, small-cap stocks had been lagging, but that changed this month. For December, the Russell 2000 ETF gained a hearty 12.13%.
With such a sharp rally, the natural tendency is to view it as over-extended, over-bought and likely to reverse.
The Trend-Following mindset, on the other hand, is that strength tends to beget strength. Looking back at history, this has been the case with the Russell 2000.
Referring to the monthly chart below, there have 5 instances where the index jumped by 12% or more as numbered below:
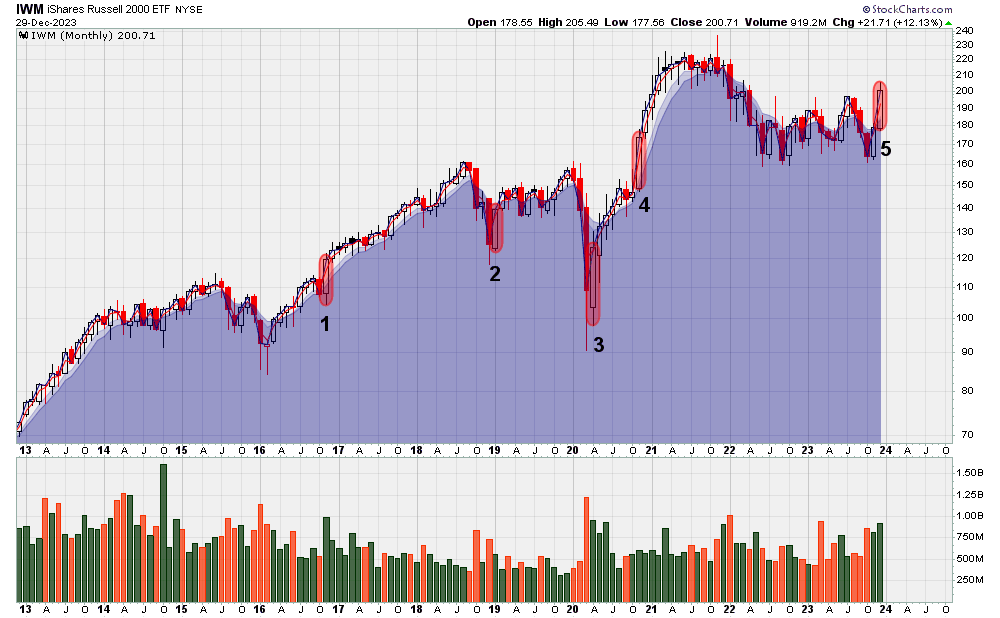
Notice how in each case, the following monthly candle was white, meaning a continued month of strength. In most instances, these sharp rallies begot further strength for several months down the line.
This notion that strength begets strength can also be found in the S&P 500. In this example, Charlie Bilello documents how a strong 2-month gain tends to beget additional strength down the line:

This kind of thinking isn’t exactly a prediction, but more of an observation that markets tend to trend. An object in motion tends to stay in motion.
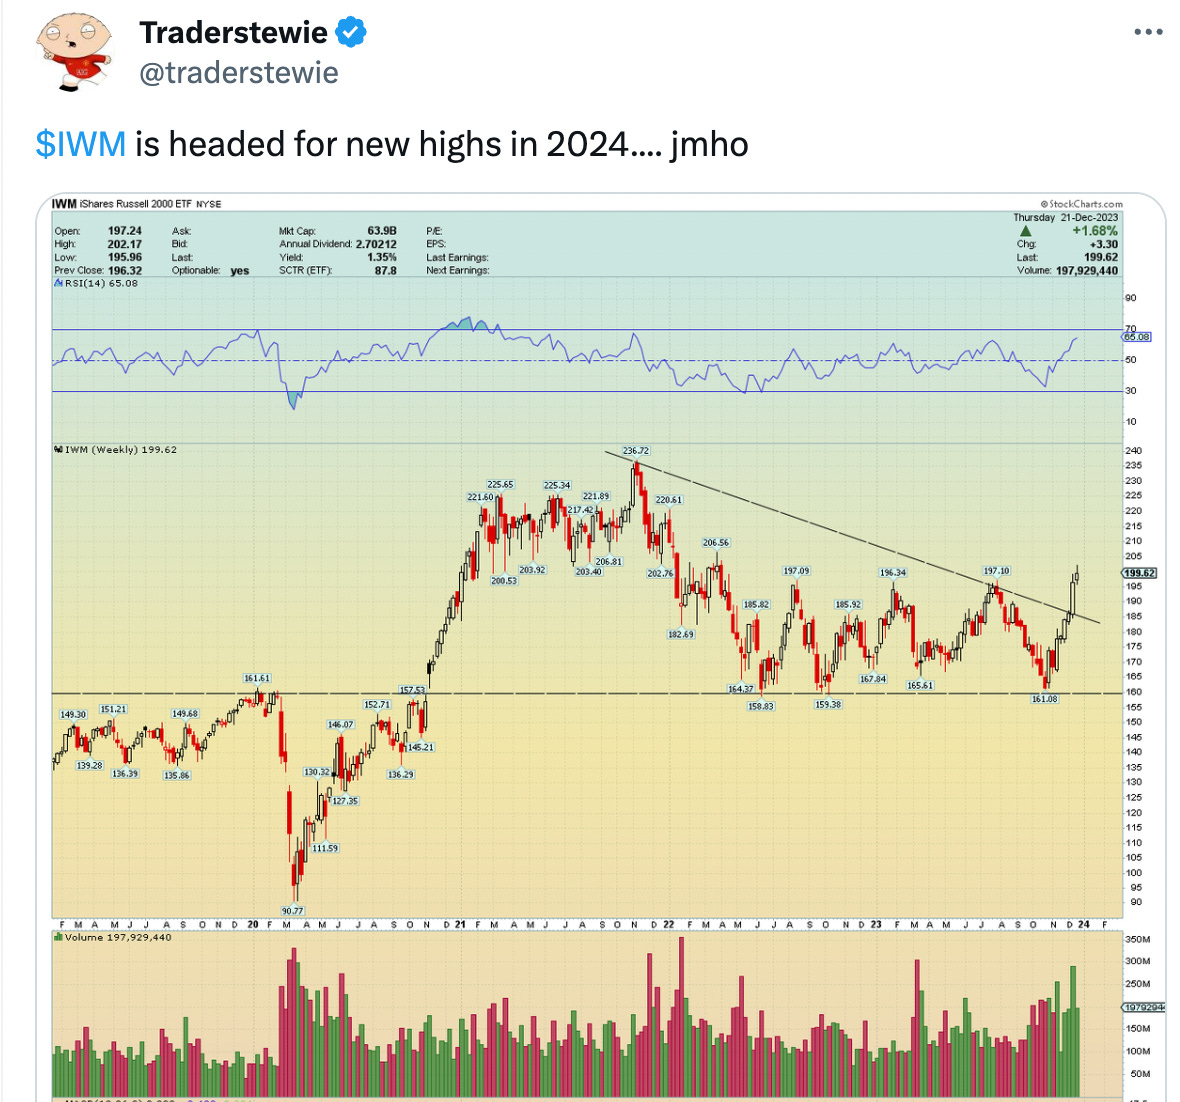
But everyone loves a good, old-fashioned prediction once in a while and if that’s what you’re looking for, might as well go with someone who has 25+ years of trading experience.
Interesting ETFs:
Here are two ETFs that have a lot of potential for the year 2024. These are long-term monthly charts, so it doesn’t mean they’re going to go up tomorrow, but look constructive from a 30,000 foot vantage point.
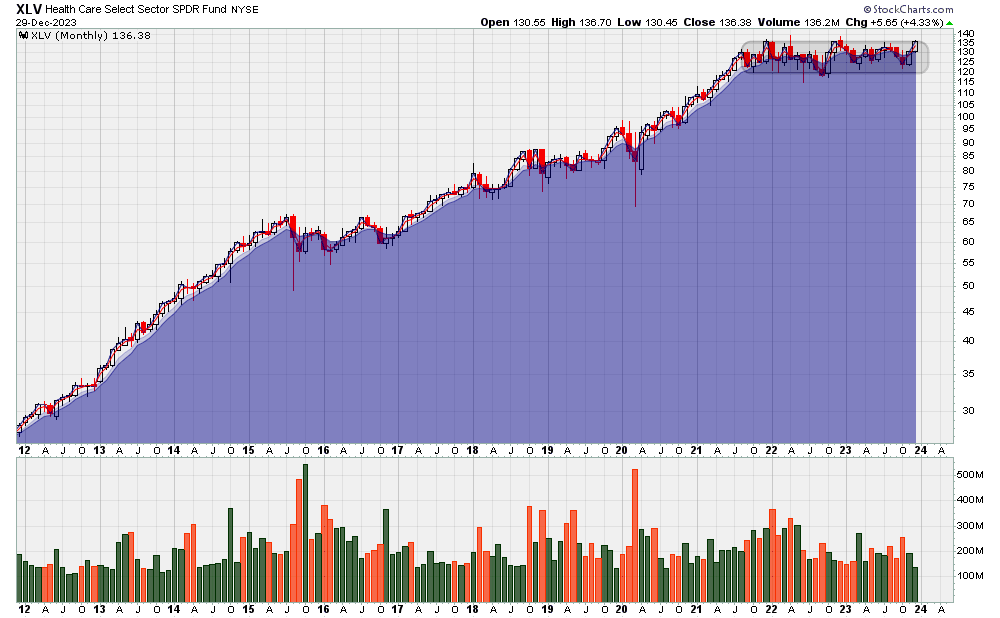
Health Care. There are hundreds of health care related stocks that have been sitting this rally out and, as a result, have been going sideways for over 2 years. That may be about to change as price today is on the cusp of a breakout into new virgin territory:
Pharmaceuticals: This entire sector has been forming an immense, compound base for the past 8 years. Though not an an all-time-high, the ETF’s 13% gain for the month of December is a force to be reckoned with.
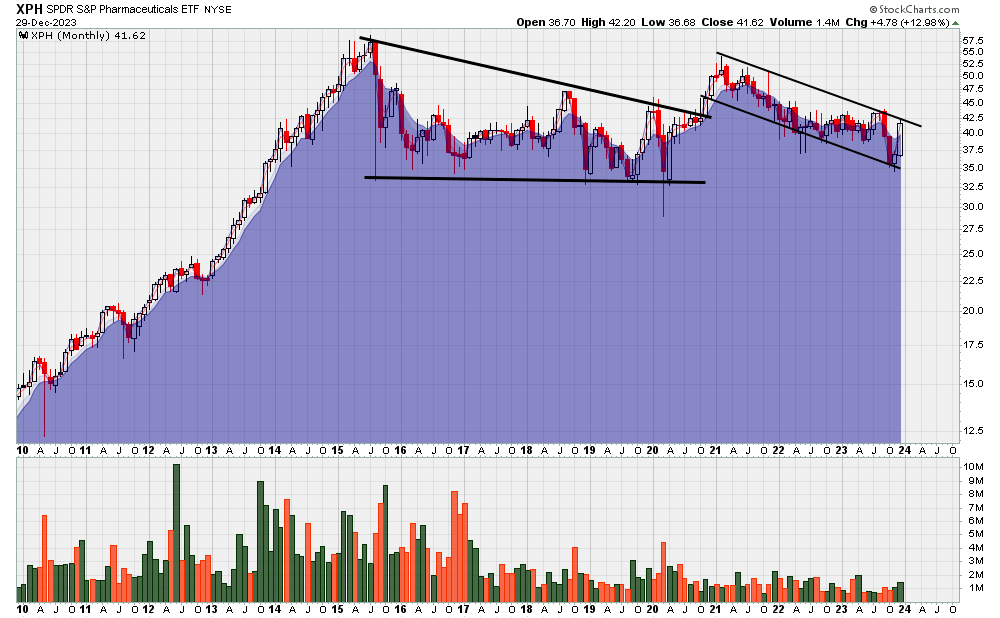
Relatedly, Biotech funds such as XBI and IBB have been basing for years. Between these ETFs - XLV, XPH, XBI and IBB - there are thousands of stock, stocks that you have never heard of, that have the potential to move up explosively.
Individual Stocks:
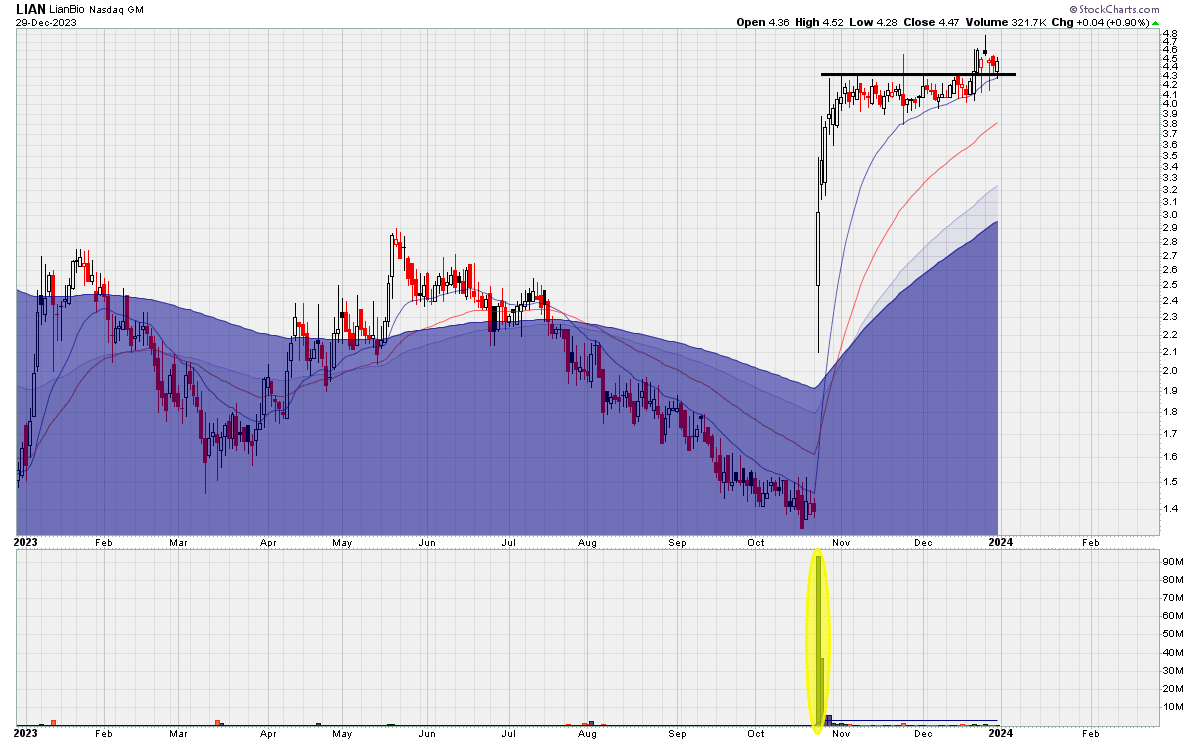
Speaking of biotech stocks, I did purchase one such stock this week:
I used to have a friend who refused to buy biotech stocks and also refused to buy Chinese stocks, as he considered them too risky.
Now this stock above, LIAN, is a Chinese biotech stock so, wow, it must be doubly risky!
For my friend, he only traded huge positions in stocks, or if he’d come across a stock like LIAN, he simply wouldn’t trade it at all.
There is, however, a third option: trade a small position. It doesn’t have to be all or nothing.
Because LIAN is not trading at an all-time-high (just near a 52-week-high), I’m willing to risk a maximum of 0.20% on the trade, and because the stock is quite volatile the resulting position size, based on a hypothetical $100,000 portfolio, is very small indeed:
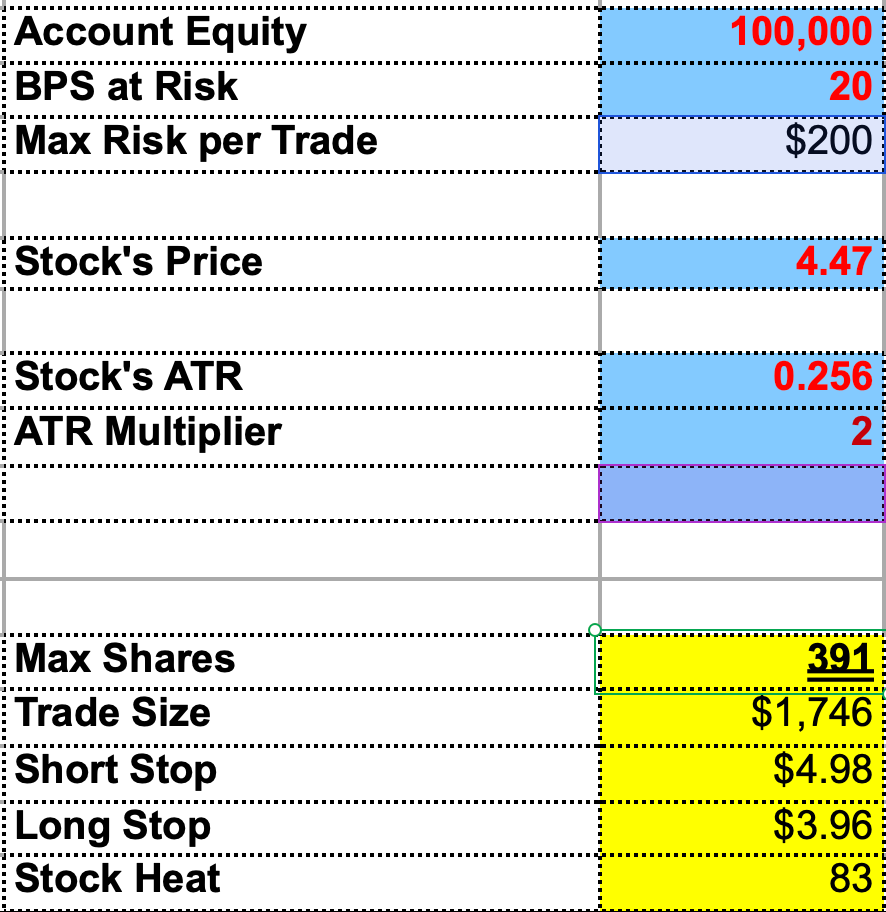
Every biotech stock does have the potential to gap-down savagely on you overnight, and this has happened to me dozens of times before; however with such a small position you can absorb such a blow and keep trading.
Now if you think you can’t make money trading such small positions, then you simply need to add more, uncorrelated, stocks to your portfolio to juice up performance.
For additional stock ideas, I like to identify stocks that experienced a white candle (i.e. closed higher than they opened) given that Friday was an overall black candle day.
For instance, YELP, closed higher than it opened on Friday, despite a down day for the market on Friday:
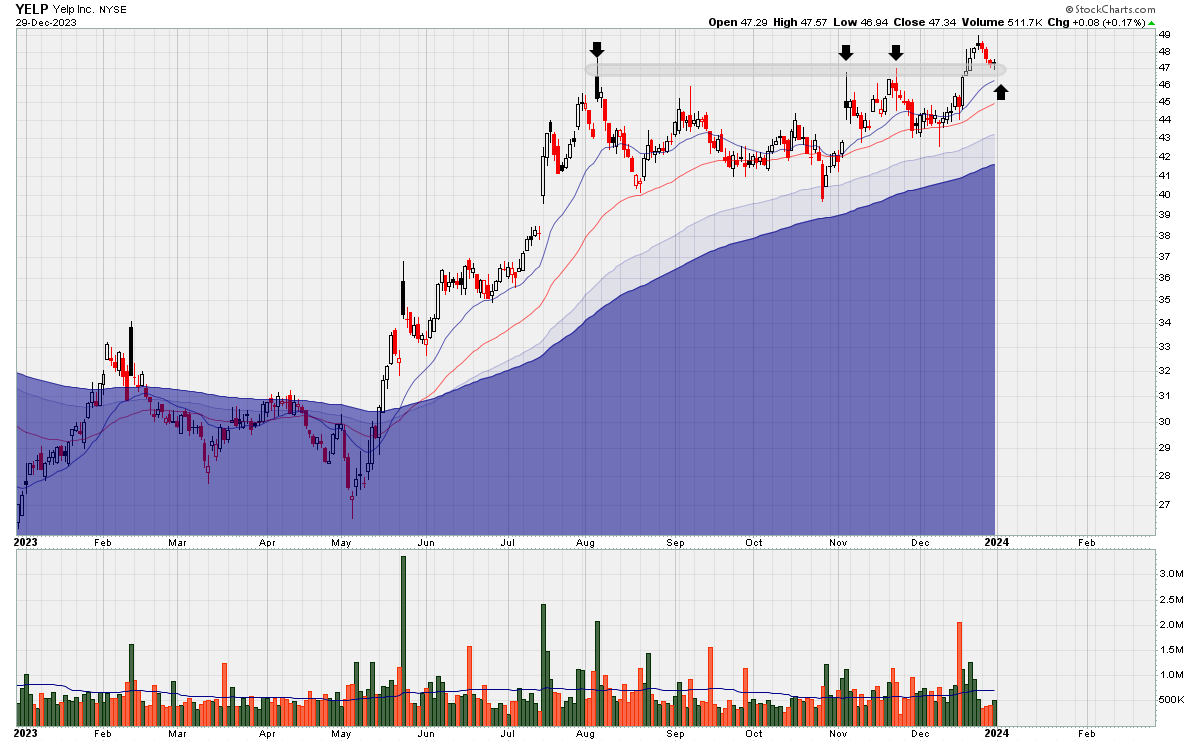
The stock is at a logical support level as well, and is nestling in towards the 20ema, the line in the sand that would prove my trade idea wrong.
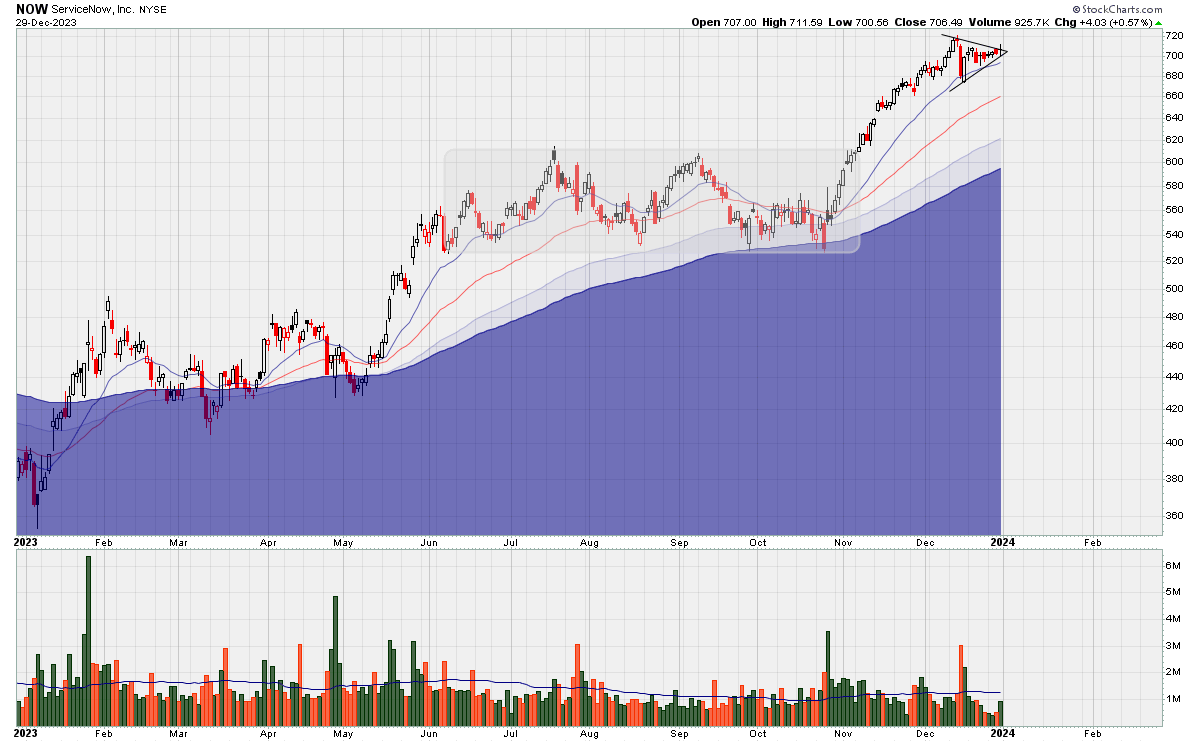
Another stock that rose on Friday was NOW:
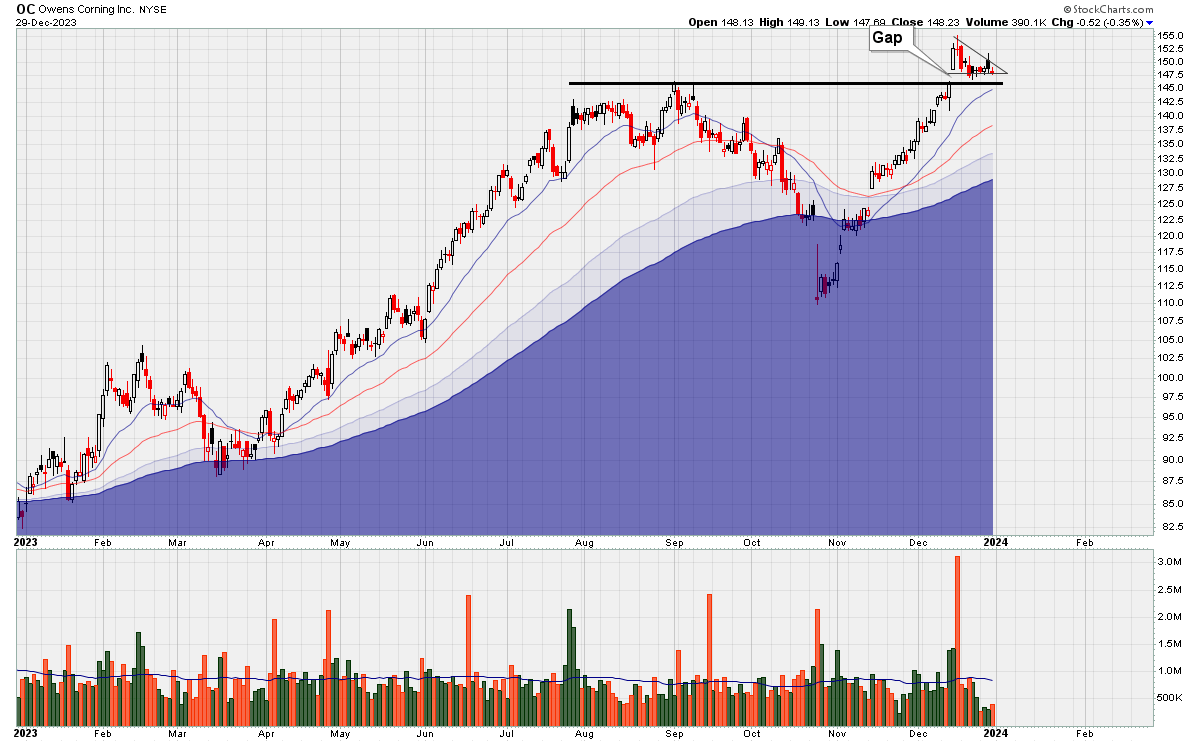
Moving on, OC is another stock that I bought this week:
And SLNO:

Finally, AIF printed a conspicuously big white candle despite Friday’s weakness:

Gold Analysis:
Gold’s long-term monthly chart is extremely solid:

Although it never rallied much this year, it also refused to go down, providing an ideal opportunity to write put options for income while still allowing your cash to earn interest.
I’m also open-minded about adding individual gold stocks to my portfolio and did add this small, Canadian miner recently:
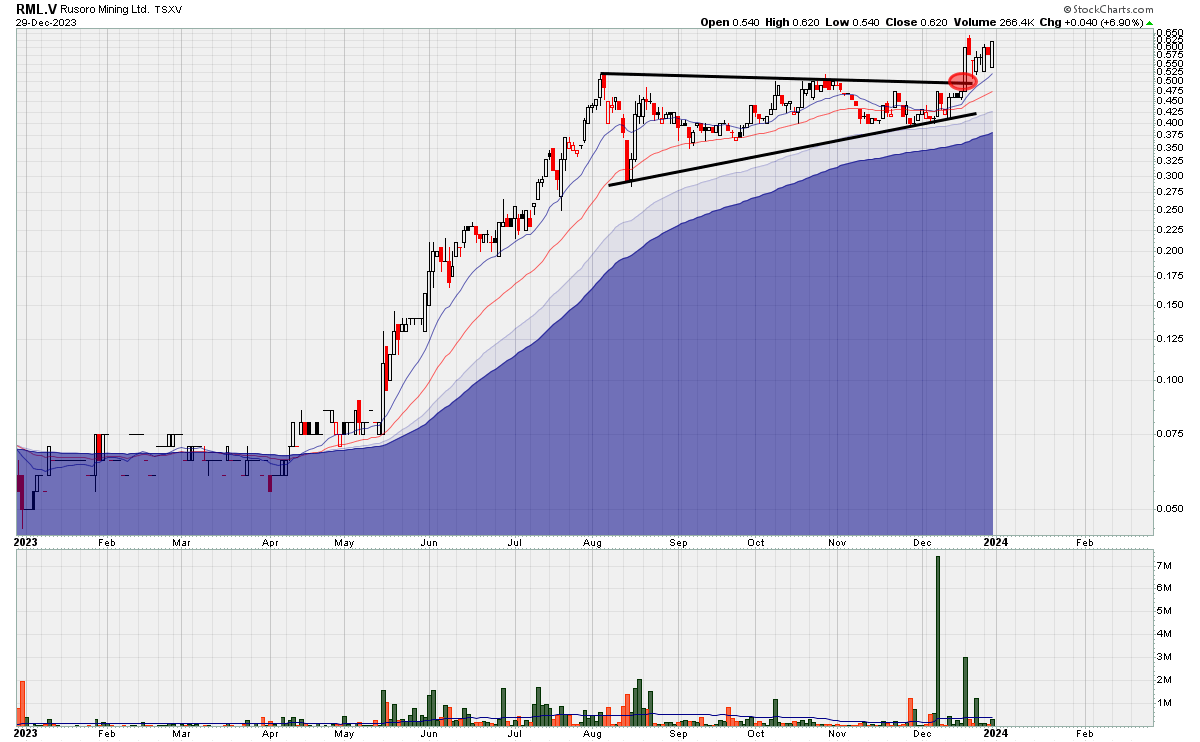
Trend-Following is about making many small bets that have an asymmetric risk to reward profile.
With my trade in Rusoro Mining, the risk is limited as the 20ema is in close proximity, cutting off my downside. The upside is always uncapped. There is nothing stopping this stock from rising to, say, $5.00.
Trend Following Discussion:
Another factor that made this year unusual is that many strategies that I disagree with, such as buying new lows, averaging down, and HODLing crypto did very well; while at the same time, strategies that I do agree with, such as Trend-Following, did poorly.
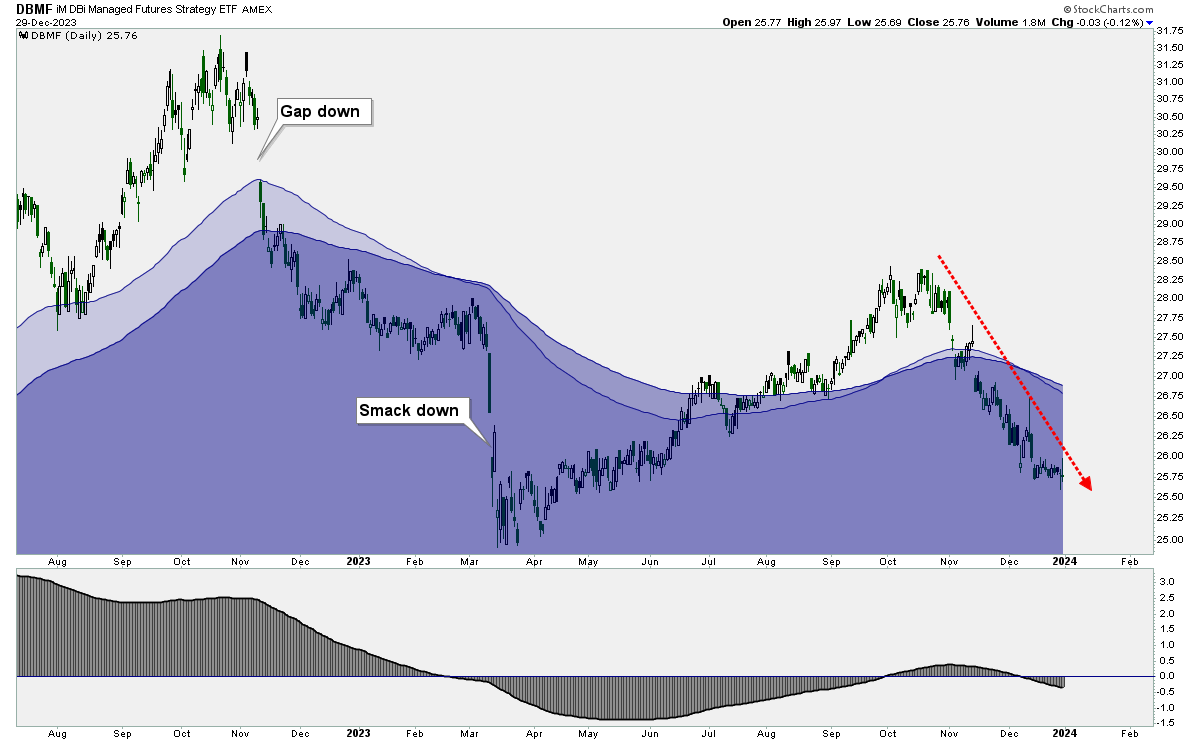
For example, the Trend Following ETF I previously mentioned was down nearly 10% for the year:
In addition, the fund started by Bill Dunn, a true Trend-Following veteran, also declined for the year:
Now before you conclude that Trend Following is dead, keep in mind that Bill Dunn was up 60.24% last year.
This means that over the past 2 years, a $100,000 investment with Bill Dunn would be worth $131,621 today.
In contrast, the same $100,000 investment in the S&P 500 would be worth $99,650. Yes, the S&P 500 is actually down over the past 2 years, despite somehow being in a raging bull market the whole time.
Likewise, a $100,000 investment in Bitcoin 2 years ago would be worth $90,300 today.
So Bill Dunn investors over this period are 46% richer than Bitcoin holders, but Bitcoin is great and Trend-Following is dead. Okay.
Performance Review:
My own performance for the year 2023 was disappointing with a gain of just 7.2%.

Nonetheless, performance over the past 2 years is better with a $100,000 investment being worth $125,102 today, considerably better than the zero return generated in the S&P 500. Going back further still, such as 5 or 10 years, yields even greater outperformance.
A unique feature of 2023 was that momentum stocks greatly underperformed and Trend-Following also underperformed.
I’ve experienced a choppy Russell 2000 before, such as in 2015. Back in 2015, stocks went nowhere, but luckily there was an epic collapse in crude oil during the summer of 2015 that I was able to latch on to.
This year however, no futures markets trended. Crude Oil refused to move in any direction for long. Gold refused to breakout. The US Dollar was stagnant. Silver didn’t budge. Bonds experienced a massive recovery and ended up flat.
At the end of the day, though, one year just isn’t that significant. Referring back to Bill Dunn, his track record goes back to 1973. As we just entered 2024, that means his track record is now in its 51st year.
Longevity is the key to success.
I hope 2024 marks the return of trend following!