Market Review:
The high volatility trading range received an extra dose of volatility this week resulting in almost all year-to-date gains vanishing.
This hasn’t been the first time a promising rally quickly crumbled away. In fact, it’s been happening over and over again for over two years now:
With dozens of false rallies and hundreds of failed breakouts, there’s no question that momentum trading isn’t working. The only question is why isn’t it working and when will it start working again?
My hypothesis for a while now has simply been that this isn’t a bull market. Momentum trading is a great strategy, but only when the market conditions are right.
To think of it another way, for example, you can say that a Ferrari is a great car, but only under certain road conditions. Put a Ferrari on a muddy jungle road and it’s useless.
Likewise, long-only momentum trading is useless now because the conditions aren’t right.
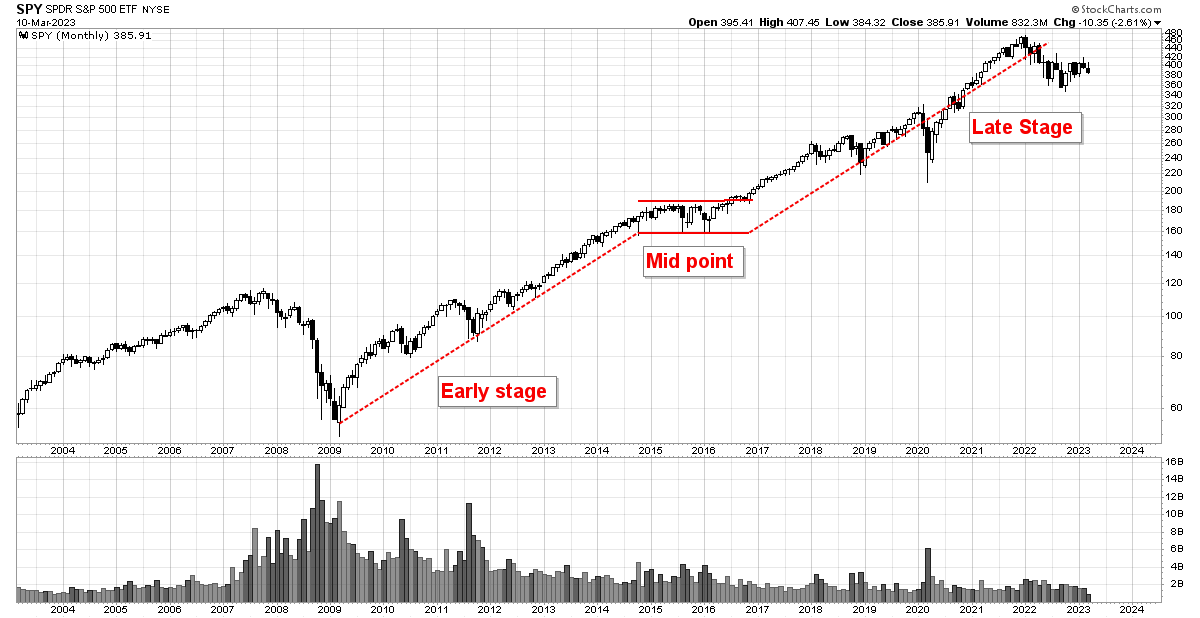
The best conditions for momentum trading occur at the beginning to middle stages of a bull market. The chart below show that momentum traders enjoyed many years of favourable conditions:
Interestingly, the dashed diagonal lines are exactly the same length meaning the bull market unfolded in two equidistant waves with a consolidation in the middle.
From the mid-point onward, the market continued to offer momentum traders good opportunities until around 2021 when the bull market became extended; with fewer and fewer stocks rising, this led to narrowing breadth.
By the end of 2021, breadth became so narrow that only a handful of mega-cap stocks were left supporting the market. With so few stocks rising, this ushered in a very challenging market environment for momentum traders that has lasted until today.
Unfortunately, I don’t see any evidence that things will improve any time soon. Contrary to popular belief, this recent rally was never the start of a new bull market.
Rather, it was a short-covering-rally that is occurring within the context of a new secular bear market that has the potential to last for many more months.
Financial News:
I’m not really into reading financial news, but nonetheless it was impossible to miss the story involving Silicon Valley Bank (SIVB).
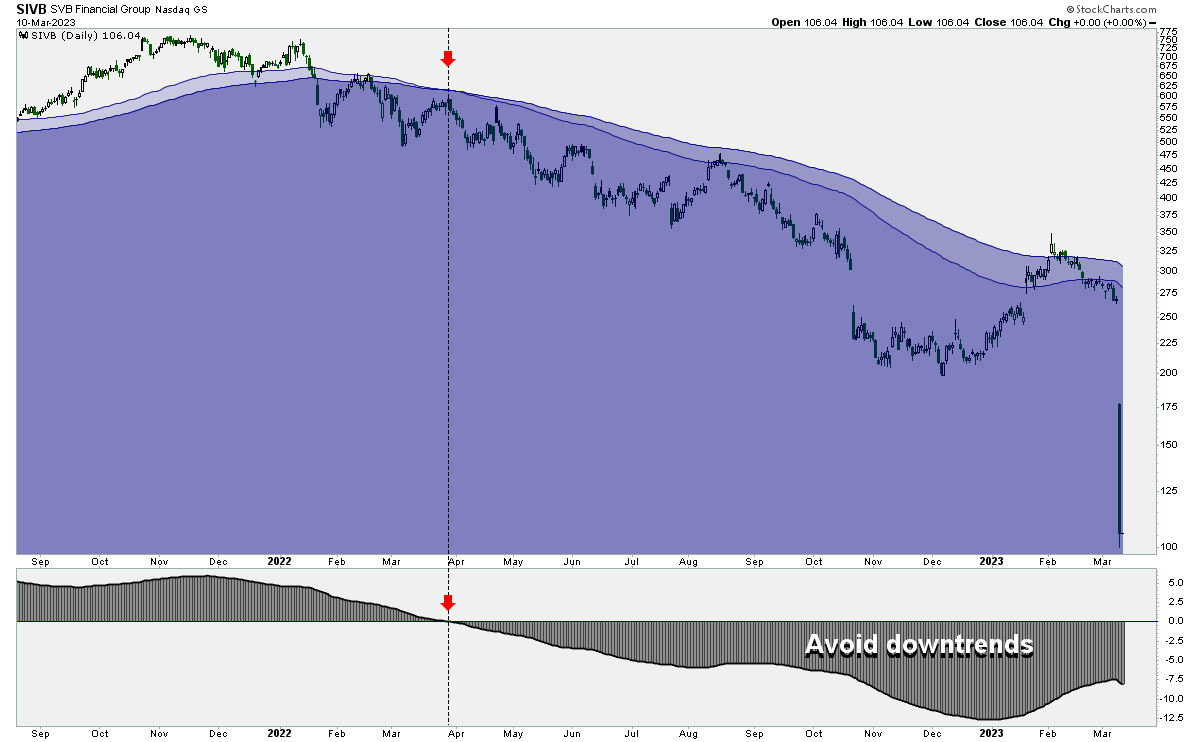
Although the details behind this story may be complicated, the chart of the stock shown below is very simple.
I use a 100 and 150 day moving average to define the long-term trend. This certainly isn’t the only way to define a trend, and it may not be the best way, but it does a reasonably good job of keeping me out of trouble.
With this basic chart and with just a quick moment of analysis, I know the stock is garbage and the fundamentals are terrible.
Stocks in downtrends tend to have lousy fundamentals because there are a lot people out there who are a lot smarter than me and who know a lot more about the company who are selling.
The people who know the most about a company are typically those working for the company itself and there is evidence that insiders were unloading shares prior to the meltdown.
All of this smart-money-selling translates into weakness, which translates into a downtrend, which translates into a warning for me not to buy it.
"'Surprises' aren't a 50/50 proposition, they tend to occur in the direction of the dominant trend." -
Individual Stocks:
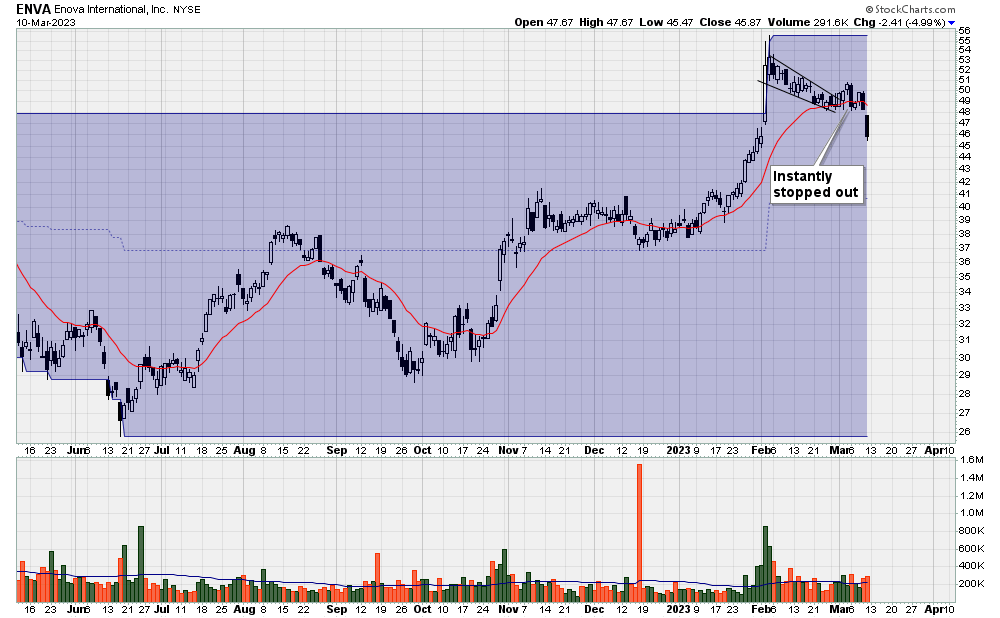
Last week, I mentioned ENVA as an example of an ideal buy candidate. From there, within 24 hours, I was stopped out of the trade. If I had the ability to feel emotions, I guess this would be called “frustrating”.
Anyway, I sold ENVA because price closed below the 20 day moving average. A rule like this is systematic and has nothing to do with predicting the market. In other words, I sold because price did go down, not because I was predicting price would go down.
Another stock I mentioned last week was HITI, but this time I was short. Unlike my long positions, shorts did well this week and there was no reason to exit any shorts given that none of them broke the 20ema.
So the portfolio is always reshuffling, readjusting, evolving in a non-predictive way to the current market conditions.
Trading Books:
With ten months remaining in the year, I thought it would be a good idea to review one of my top ten trading books each month.
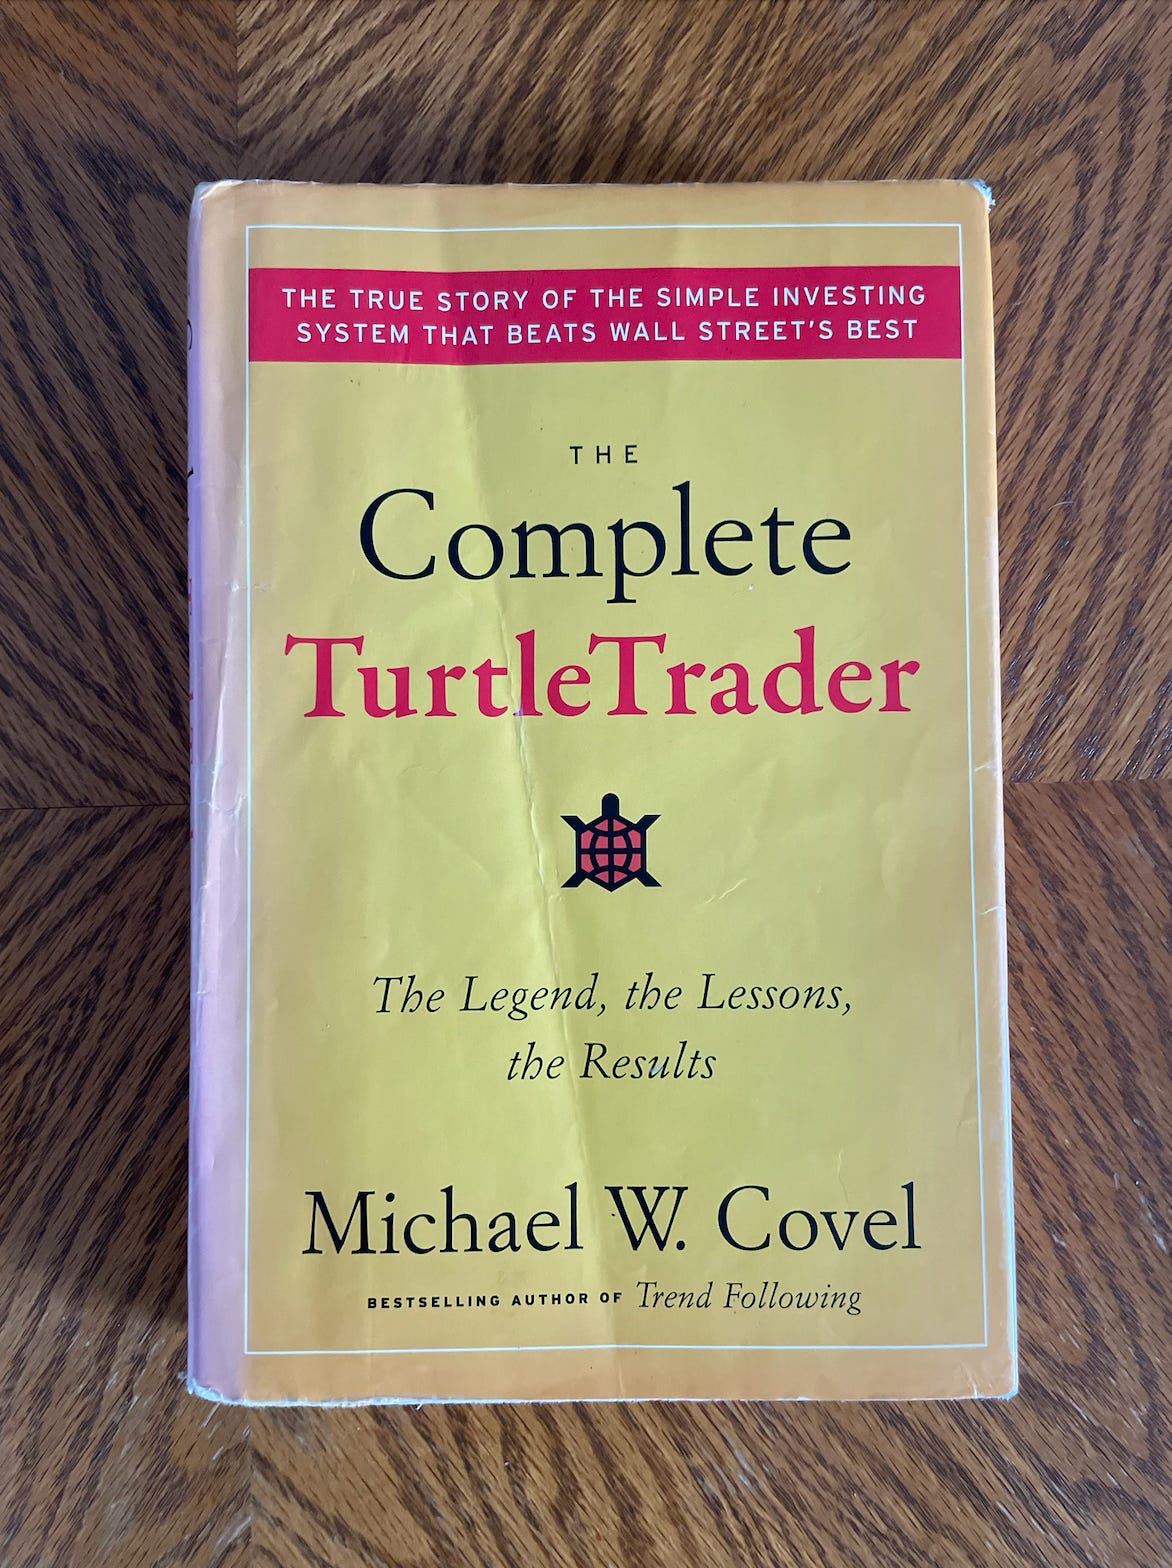
Going through my library, it was clear that there was one book that was more worn out than all the others and that’s because I lent it to friends and colleagues the most often.
But before I go into the reasons why I think the book is so beneficial, I’ll tackle the most common objection The Complete Turtle Trader receives.
The main objection is that while the Turtle Trading Strategy worked really well in the past, it no longer works today.
My counter argument is, surprisingly, to admit that this is true. But that inconvenient fact actually doesn’t matter as much as you might think.
Basically, the very fast type of Trend Following systems that the original turtle traders employed don’t work well today. It doesn’t lose money, but it doesn’t make much either.
Most of the traders profiled in the book solved this problem by lengthening their timeframe. That’s why, for example, Jerry Parker uses a 200-day-breakout system rather than a 20 day breakout.
More importantly, however, the exact entry technique isn’t as important as most people think.
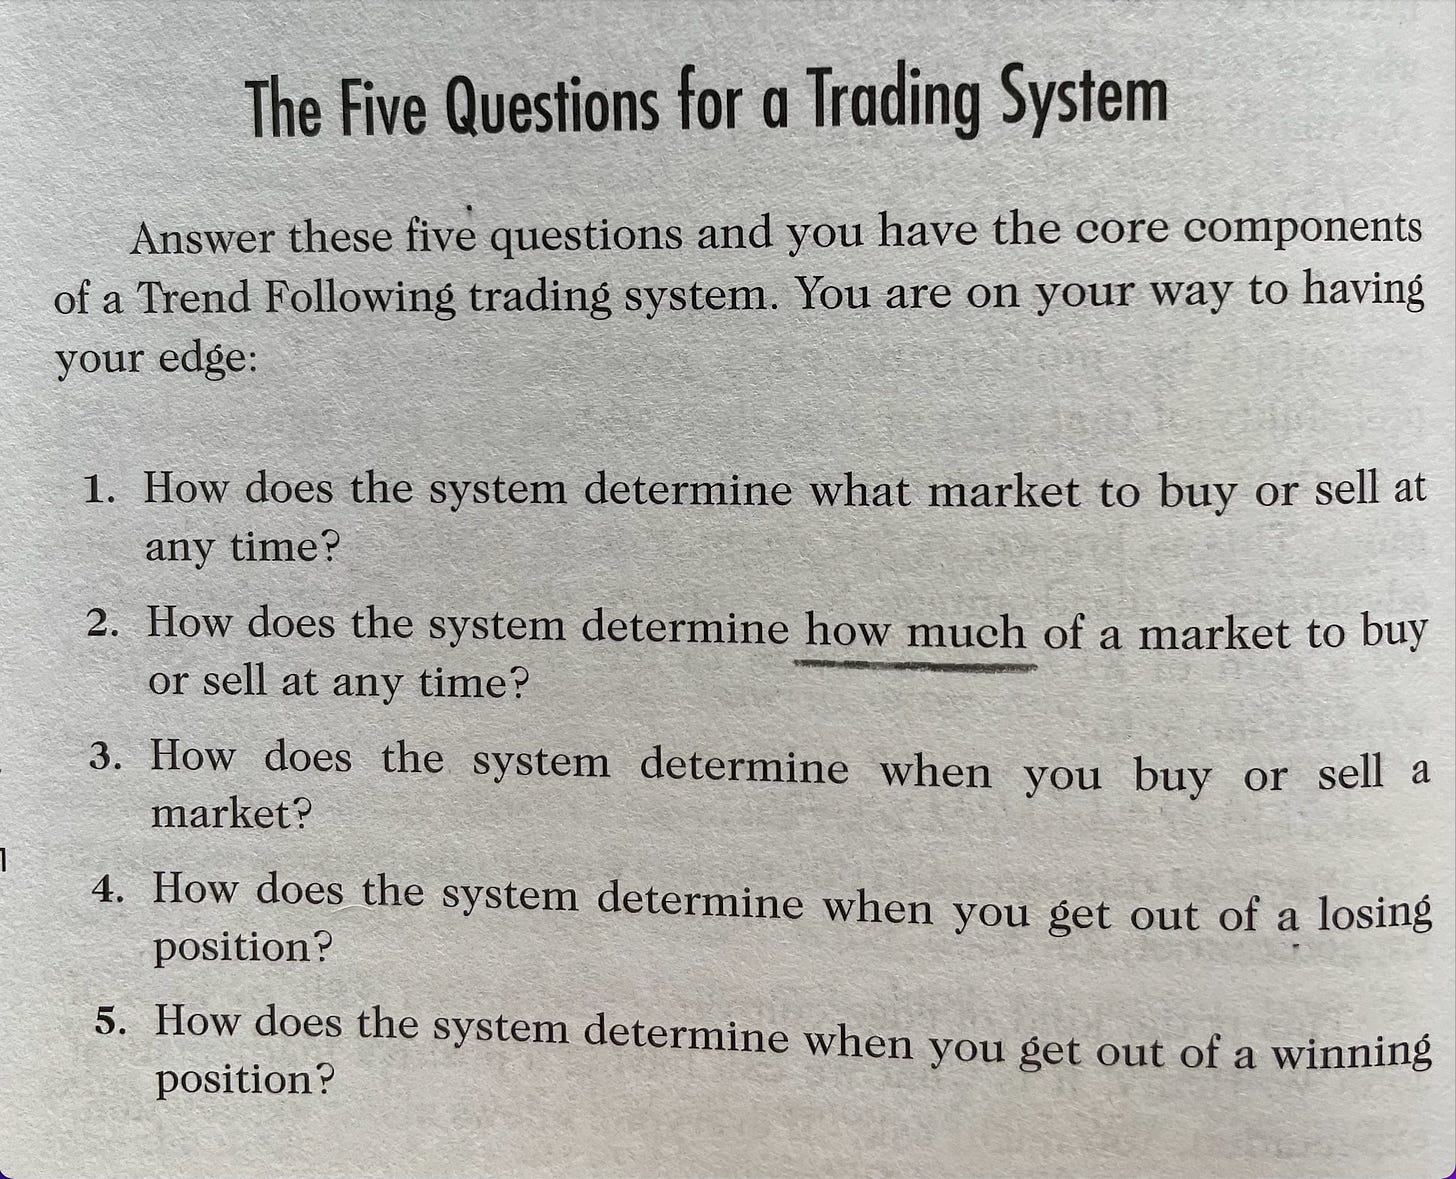
Determining “what to buy” is a part of any trading strategy, however a complete trading system must be able to answer all five of these questions:
Almost the entire trading world from FinTwit to CNBC is solely obsessed about question #1. What’s the next hot stock?
Moving on to question #2 and we have a very different story. I highlighted just two words “how much” since that is, by far, the most important question that new traders pay absolutely no attention to.
This question is akin to the dosage in a medical prescription. Is Aspirin a good medication? If you take a single pill, maybe. If you take a hundred pills, you’re probably dead.
Just as a prescription without the dosage is useless, a stock tip without the position size is worthless. That’s why I always chuckle when I see a buffoon like Jim Cramer hooting and hollering about what stock to buy. I always think, umm… okay… and what about the rest of the equation?
Therefore, what I love about The Complete Turtle Trader is that it does an excellent job of answering the all important “how much” question.
Based on this book, I developed a spreadsheet that tells me exactly how many shares to buy. I realize that a spreadsheet isn’t going to be a hit with the average trader and having previously worked at a dead-end office job, I hate spreadsheets as much as anyone.
But this spreadsheet is good. And fortunately for me, it only involves addition, subtraction, multiplication and division.
To solve the riddle of how many shares I buy, you simply key in the coloured areas in the spreadsheet below.


