

Newsletter of Danny Merkel - Issue #150

Market Review:
Last week I presented an optimistic view of the market based on the premise that SPY hit a new all-time-high.
While it still makes sense to be bullish on SPY, it should be pointed out that beneath the surface, the picture is less rosy.
Without the magic of indexing, the average stock within the S&P 500 appears much worse. And if you look at the average stock outside of the S&P 500, it’s worse still.
The next chart is unique because it contains every liquid stock in America. The top panel contains the 500 stocks in the S&P 500 and the bottom panel contains the 3,636 stocks that aren’t in the S&P 500.

Containing 4,136 stocks in total, this is the most comprehensive picture of the US stock market possible. Every stock in America is included and there is no overlap between the top and bottom panel: either a stock is inside or outside the S&P 500.
Now from this vantage point, it seems clear to me that there is something wrong. This is not what a healthy bull-market should look like.
Going back three years, the above chart does show some progress on the top panel, but it’s been an alarmingly erratic ride.
The bottom panel shows that the 3,636 stocks outside the S&P 500 are lower today than they were three years ago.
Given that such a huge number of stocks have gone nowhere in 3 years, and because the cumulative inflation over this time is around 15%, I think it’s fair to say that something is wrong.
In this broken, choppy market new highs have tended to fade quickly.
This new year has already seen many new highs fade, as the iShares Growth ETF shows. Trading under the symbol IWO, this index of growth stocks has been ping-ponging between 52-week-highs and 52-week-lows all year:

Referring to the above chart, buying new 52-week-highs appears foolish. Why on earth would you wait for a new high, when you can just buy at a low price instead?
The rationale for buying new highs is that markets (in the long run) tend to trend and a new 52-week-high is a sure sign of an uptrend.
For example, the same index of growth stocks rang in the new year of 2013 with a new high and - unlike today - kept trending higher.

Also, I’ve noticed that the very first trading day of the year can often set the tone for the rest of the year. Notice in the above chart the bullish gap up that occurred on the first trading day of 2013. That first day of trading set the tone for the rest of the year.
On the other hand, the first trading day of this year started with a gap down. You had everybody getting extremely bullish, including me, and they all got hit with a gap down on the first trading day of the year - that may be a harbinger of things to come.
Buying new highs is also a defensive strategy that keeps you out of trouble. Back in 2008, IWO printed zero new highs all year: that was useful information - stay out.

Also, buying new lows, while having worked well last year, will lead to disaster in the long run. The red arrow in the chart above highlights a fresh 52-week-low. Keep buying dips and eventually it’ll turn into a nightmare.
Trend Following Discussion:
If you follow my stock picks closely, you will have noticed that I’m in what is technically called a “losing streak”.
Every trader experiences losing streaks, but it is not something that is talked about very much on social media. “Buy my course, I’ve just had 17 losing trades in a row” doesn’t make for good marketing material.
An exception to this rule is a trader named Nick Radge. In this video below, which I believe is the best Trend Following presentation ever to be posted on YouTube, he does a fantastic job discussing this topic:
The video above cuts right to the discussion of losing streaks, but I recommend watching the 1 hour video from start to finish.
To go even deeper on the topic, I would say that losing streaks originate from Mark Douglas’ five fundamental truths of trading:

Basically, every time you put on a new trade, anything can happen and you don’t know the outcome.
Because every moment in the market is unique, and because there is a random distribution of wins and losses, losing streaks will arise just based on probabilities regardless of your trading style.
For simplicity let’s say your trading system wins 50% of the time (you make money because your gains are bigger than your losses), then based on pure math, strings of losses are inevitable:

As the table above shows, over the course of the next, say, 100 trades, you can expect to run into 7 consecutive losing trades in a row.
The next table shows the resultant drawdown you can expect from those losing 7 trades in a row based on different bet sizes:
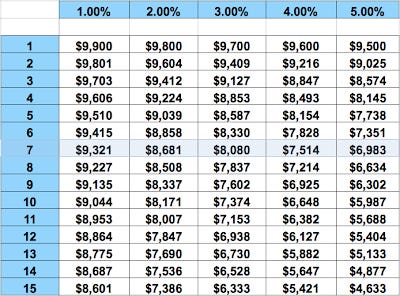
The table above shows that, for example, if you risk 5% on each trade, then 7 losing trades in a row will drawdown your account equity to $6,983. And this is the scenario based on just your next 100 trades. If you trade over the course of years and decades, you could easily run into a patch of 14 or 15 losing trades in a row.
This is why, in my studies, I have come to the realization that all old traders bet small. The reason is that had they bet big over the course of 15, 20, or 25 years, they would have gone extinct and I would not have been studying them in the first place.
Bottom Line: Losing streaks are unavoidable and uncontrollable. The only thing you can control is your bet size. If you don't understand bet sizing and risk management you will, with mathematical certainty, go bankrupt eventually.
Two basic rules: 1) If you don't bet, you can't win. 2) If you lose all your chips, you can't bet.
-Larry Hite