

Newsletter of Danny Merkel - Issue #109

Market Review:
A central theme this year has been that the market is “stalemated” meaning bulls and bears are at about equal strength and so most indexes are stuck in a range.
The next chart illustrates what I mean. The S&P 500 and its 100 & 150 day moving average have almost perfectly converged to the exact same point:
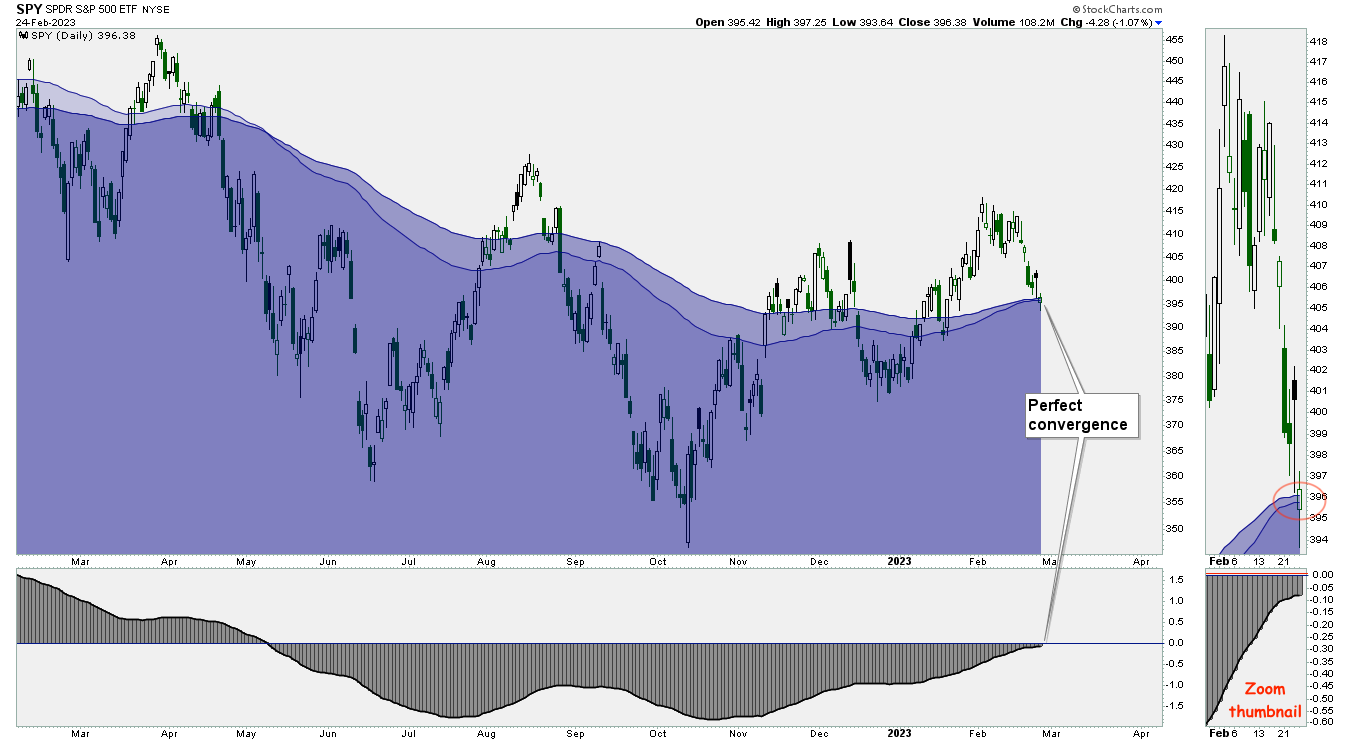
By using the zoom thumbnail on the right side of the chart, we can see that the long-term trend is still down, but just barely.
With market choppiness dialed up to 11, it’s often helpful to zoom way out to get a clearer picture.
Going back to the year 1992, this next chart shows the S&P 500 in the top panel.
Using this long-term perspective, all of the market’s recent choppiness is contained in the small white wedge.
Now, this wedge, in my opinion, has all of the characteristics of a bearish continuation pattern - not a bottoming formation:

Bear markets tend to unfold in three waves and I believe this wedge represents the bear-market-sucker-rally that will set the stage for a vicious final wave lower.
Moving on to the bottom panel is the yield curve lusciously displayed as a purple and red histogram.
As a Trend Following trader, I don’t actually make trading decisions using this, but I include it here simply because I find it interesting. Or maybe it’s confirmation bias. In any case, the histogram is now the most inverted in decades.
An inverted yield curve was a harbinger of things to come for both of the previous bear markets. Maybe this time is different, but either way I think it’s especially important to remain vigilant and manage risk.
Finally, with February almost over, we can get a pretty good idea how the monthly candles will finish up.
The monthly bar for ARKK isn’t encouraging.

With a long upper shadow, this indicates that the bulls attempted to keep the rally going, however, the bears stepped in slamming price back down to the low of the month.
Although the rally in ARKK may have seemed impressive at first glance, by zooming out to the monthly (as shown above), the reality is that this bounce doesn’t reverse the monumental technical damage that took place last year.
Remember that super-performance trades - trades that have the potential to increase in value multiple times - occur when a breakout takes place on all timeframes. By referring to the often neglected monthly chart, it is clear to me that ARKK’s upside is limited due to an abundance of overhead supply and should be avoided.
Option Trading:
As I cycle through charts each day, it’s becoming increasingly clear that almost every index and ETF is stuck in a trading range of some sort.
Whether it’s US large caps, small caps, momentum, value, growth, emerging markets or even gold, silver and crude oil - it’s been really choppy.
Sideways markets present a major challenge to Trend Following traders, but there are alternative strategies one can use to extract profit from a lack of movement.
The strategy that I’m about to explain has been marinating in my mind for the past 7 years and I’m finally now ready to share my findings.
Many years ago, I read a rare and almost impossible to find book called “The Momentum Gap Method”, which ended up having a big impact on my trading, specifically helping me to fully understand the importance gaps can have.
