
Newsletter of Danny Merkel - Issue #110
Newsletter of Danny Merkel - Issue #110

Market Review:
Friday’s price action I would consider to be mildly bullish with a minor breakout from a pennant but, bigger picture, it’s still chop city out there and the high volatility trading range continues.
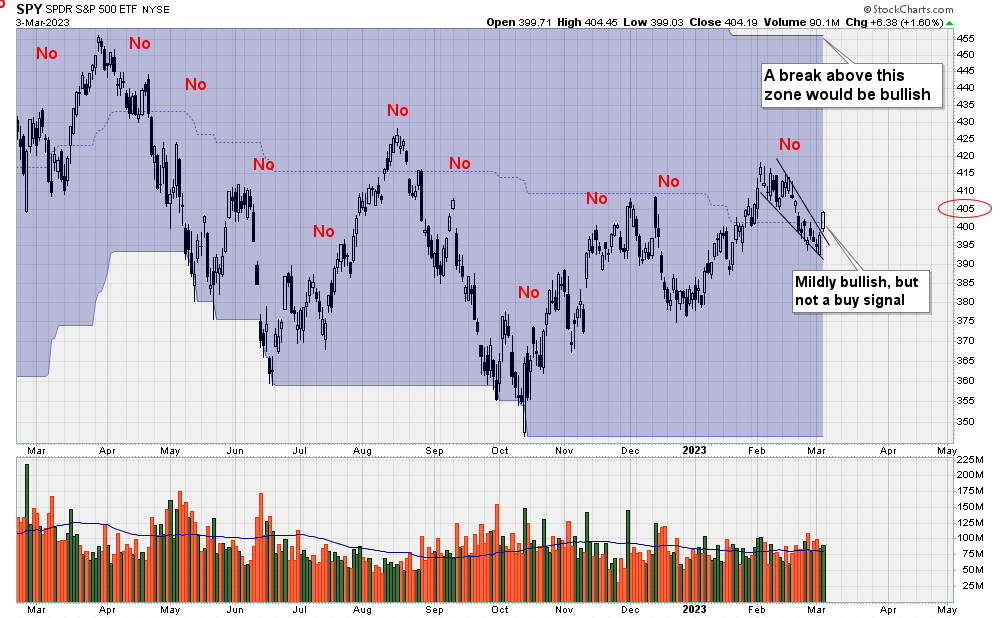
This week’s rally takes price back, once again, to the $405 level, a level that SPY has been bobbing and weaving through for months.
Without trading rules, this chart would likely be incredibly confusing and stressful to trade. However, imagine trading with just a single simple rule:
Only buy when price closes at a new 52-week-high.
Now armed with this new Trend Following mindset, you can see that SPY formed “No” new highs this year. This means no new buy signals.
But can the average trader look at SPY everyday and have the discipline not to trade it? Probably not. Trend Following is simple, but that doesn’t mean it’s easy.
Having the discipline not to take sub-optimal trades is one of the characteristics that separate mediocre traders from great traders.
There have been a lot of junk-off-the-bottom rallies so far this year that I’m sure appeared tempting to those craving action, yet were never actually quality buy signals.
For example, LCID exploded higher a month ago and with new traders lusting for action, the FOMO was probably too great to resist.
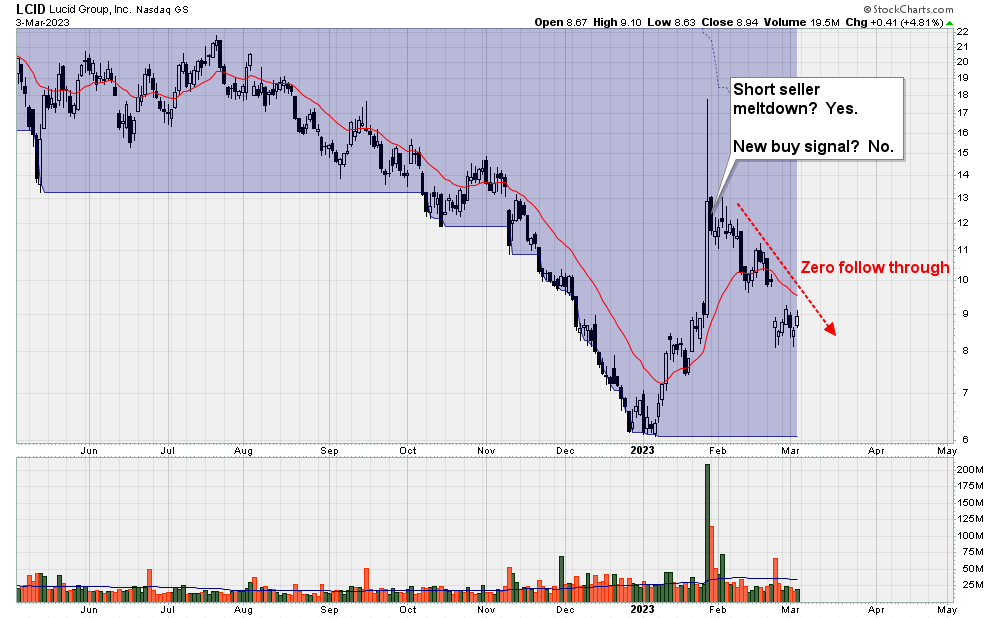
Yet I trade 52-week-highs and LCID has formed exactly zero new highs this year, so there wasn’t even anything for me to think about.
And that was for the best, since after the shorts were blown out, there was nobody else left to buy and price tumbled back down.
The bottomline is that this trendless, high volatility trading range can cut up your trading account if you chase sub-optimal trades.
Individual Stocks:
As you can probably tell by now, I really have no idea where the stock market is heading going forward. Nobody else does either, but some people are just at different stages of realizing this fact.
The best that I can do is buy stocks that look good and also short sell stocks that look bad. Importantly, I use the indexes to determine the strength of the overall market and take larger positions in bull markets and smaller positions in bear markets (see Issue #107).
Generally, what looks good to me are stocks breaking-out at or near 52-week-highs.
For instance, ENVA appeared on my scans when it burst higher to a new 52-week-high. However, at that moment, the stock had already advanced 10 consecutive days in a row and was over-extended:

Therefore, one could place such a stock on a watchlist and patiently wait for a new base to appear. As shown above, ENVA was able to catch its breath by forming a pennant, descending calmly to the 20 day moving average.
Because I always sell stocks that close below the 20ema, my risk is very small, but if the stock continues higher, my upside is open-ended.
So even though the S&P 500 is stuck in a trading range, it doesn’t actually matter since I’m not buying the market, I’m buying ENVA. That being said, by referring to SPY, my rules indicate that this isn’t a bull market. For this reason, my position size is 75% smaller than normal.
In summary, ENVA is a stock that looks good to me, but it’s a small position that could easily get stopped out by closing below the 20ema; and that would be okay.
Moving on, in terms of shorting, generally what looks bad to me are stocks breaking down to new 52-week-lows.
For instance, NOTE appeared on my scans due to the fact that it printed a new low on January 30th:
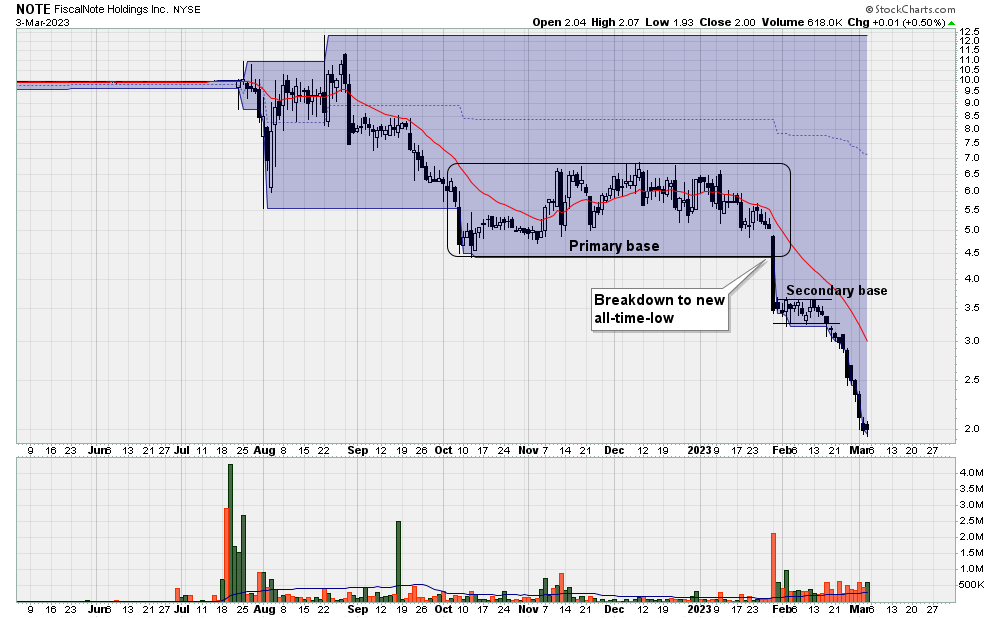
Notice, also, this was a fresh new low coming out of a primary base. Plus it wasn’t just a 52-week-low, but an all-time-low. Even better.
From there, price formed a small secondary base providing a perfect zone to short into.
Given that NOTE printed a new all-time-low again on Friday, is now the time to initiate a new short? No, because the stock is extended on the downside. Specifically, notice that the chart has formed 14 black candles in a row. This is not a fresh new low.
In summary, NOTE was an ideal short candidate since it met my rules. I’m going to continue holding it until price closes above the 20 day moving average. It’s possible that I give back some of my open profits, but that’s okay. Because the position is small, I’m not stressed by random daily fluctuations.
Interesting ETFs:
An ongoing trend that I continue to find enchanting is the increase in short-term interest rates.
The bottom panel in the chart below shows that the yield on a 1-year US Treasury has just surpassed 5% (black circle).
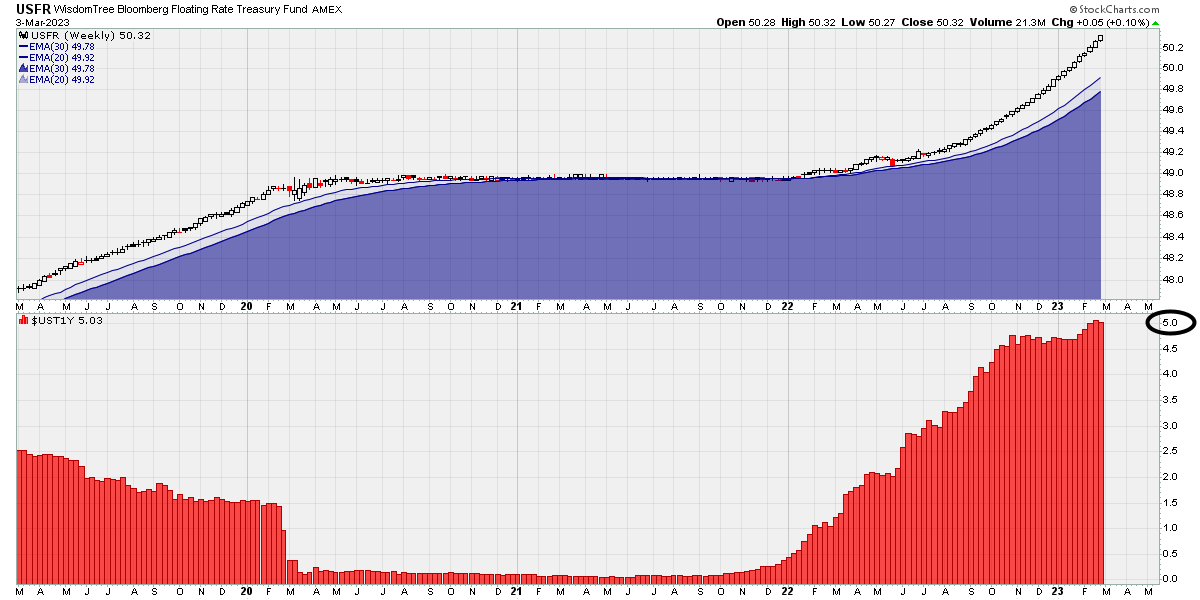
This new trend has brought life back into income generating ETFs such as USFR.
Interestingly, because USFR has management fees of 0.15% and because yields for much of 2020 - 2021 were also roughly 0.15%, USFR could do nothing except go sideways, basically breaking even.
But a yield north of 5% is a game changer in another way that I will expand on now.
Back in the days of ZIRP, it become popular to buy stocks simply because there was no alternative to generate income. Earning at least some dividend yield in a stock such as, say, McDonalds or IBM was better than earning zero interest just holding cash.
Today, however, I believe the tables have turned and I think one could make the argument against holding stocks just for income.
For example, back in December I contemplated buying IBM as it formed what appeared to be a bullish pennant:

With a blue chip stock such as IBM, I figured that the average annualized return would end up being roughly 7% give or take. But with interest rates at 5% and still heading higher, is it really worth the aggravation of having to deal with this choppy, erratic price action?
Because of USFR’s increasingly attractive yield, I skipped this trade and that ended up being for the best, given that IBM is stuck in “Chop City”.
Similarly, I also considered McDonalds as a potential buy candidate, but decided that it wasn’t worth the “headache” of having to deal with the chop when I can just earn a smooth monthly dividend in USFR, BIL or TFLO.

Basically, higher levels of interest sets the bar higher for my buy candidates. It doesn’t mean one should avoid buying all stocks, but rather provides another reason to avoid mediocre opportunities.
Option Trading:
To recap what I discussed last week, Momentum Gaps have a strong tendency to form support and resistance zones that can be capitalized on through writing options.
While some may disagree and claim that markets are random, I have seen gaps play out the same way over and over again.
One such example was when FSLY gapped down hard in October of 2020. Notice how after the gap down, price slowly recovered but - importantly - found resistance at the gap zone (black arrow):

If markets are random, then FSLY closing the gap (to the penny) and backing off from there was a complete coincidence.
Moving forward to today, NVDA formed a bullish Momentum Gap which can be