

Newsletter of Danny Merkel - Issue #102

Market Review:
Friday’s bounce is starting to help show that stocks are no longer going down. For the QQQ, this is the 4th time in a row where price has bounced off support, indicating that bears are running out of steam:
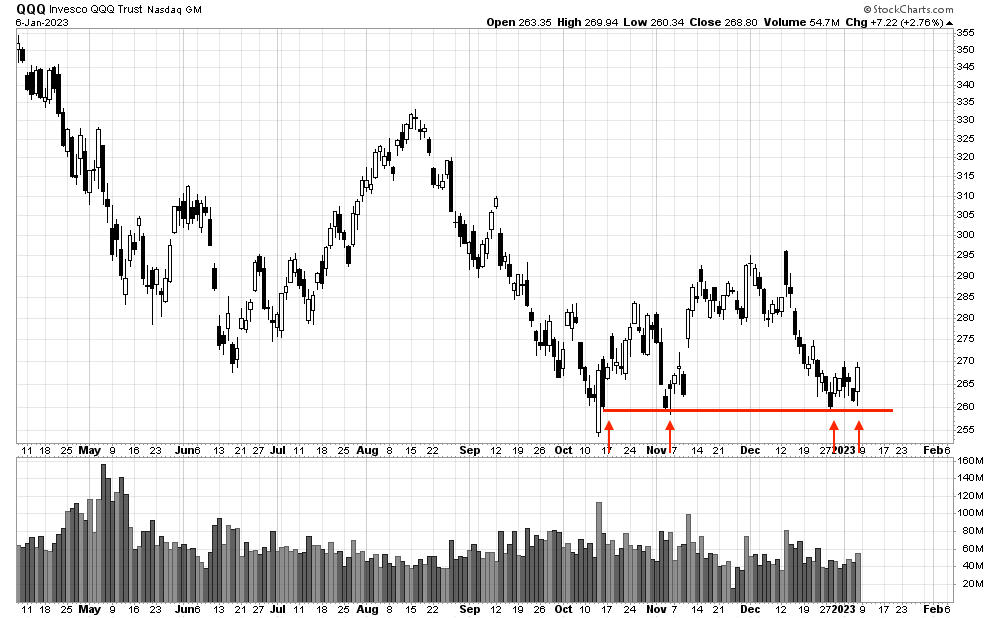
I wouldn’t go as far as to say this is bullish, since the index isn’t really going up either and the long-term trend remains down. But not going down is a start.
This lack of sustained direction has created lengthy trading ranges. The Russell 2000 has been stuck in a trading range for 10 months, but has found support at each black arrow:

This level of support is rooted in the confluence of a major gap up and also the previous highs in 2018 and 2020.
Besides the brief money-printing mania in 2020, most stocks in America have been dead for the past five years, which has made momentum trading much trickier than other periods of time, such as the 1980s and 1990s.
But markets are under no obligation to trend, and trading ranges can last much longer than expected. For instance, most biotech and pharmaceutical stocks have been going sideways for 8 years:

The chart above firstly shows a powerful bull market in biotech that ran from 2009 until 2015. Traders who had the open-mindedness to buy breakouts in unfamiliar, more speculative names enjoyed a bonanza of profitable opportunities.
Let’s go back in time and review an example of what the previous biotech bull market was capable of producing.
Back in December of 2014 (red arrow), an obscure stock that you likely never heard of called Eagle Pharmaceuticals broke out.
This breakout, as shown below, flowered into a beautiful winner and provided some valuable lessons.

Here are the key lessons that I learned from this trade:
The stock was a fairly recent IPO. Explosive winners more often than not come from newer, dynamic companies, rather than older more established names.
The trend for the Russell 2000, S&P 500 and the Nasdaq were all up during the trade, providing a tail wind for the stock. In order for a stock to grow into a big, strong winner, your money needs to be planted in fertile soil; very few stocks have this upside potential when the general market is trending down, as last year has demonstrated
Although a new issue, it still developed a tight, horizontal base for almost 1 year, building pattern pressure during this time.
Then the stock broke out to a new all-time-high on the highest volume in its history.
The stock never violated its 20ema (thin blue line) for any extended amount of time, which is a sign of strength. Strong stocks should remain above their 20ema, and for as long as they do, there is no reason to sell them.
Rather than sell a winner prematurely, my system added to the position on the way up, something I’ll discuss more in a future post.
You don’t need to understand the fundamentals to make money. When I first entered EGRX, I didn’t even know what product or service the company provided. Then, as the trade progressed, I continued not to know. Looking back on this trade 8 years later, I still don’t know what they do.
If you scan for stocks making new 52-week-highs, the best stocks will find you. The path to super-performance is always paved with new highs.
Now, it’s been a while since we’ve seen any big winners like this, but that’s normal in a bear market. Could the massive trading range since 2015 lead to a powerful new bull market in biotech? The best way to tell is to scan for new highs each day and let the results speak to you.
Individual Stocks:
Every day, I scan for stocks making new 52-week-highs and also new 52-week-lows. What was remarkable about last year is that almost every day, there were many more stocks making new lows.
In fact, there were only 19 days in 2022 where the NASDAQ and NYSE printed more highs than lows as this next rather odd looking chart shows:

From this perspective, 2022 saw a greater deluge of internal weakness than even 2008.
However, for the first time in a while, the tables have turned and we finally have some decent looking new buy ideas.