Market Review:
One interesting new development this week was that the S&P 500 decisively broke through its 200 day moving average:
In addition, price has put in a higher low after forming a long series of lower lows. This higher low as well as the break above the 200dma are both positive developments.
However, the index has not yet actually made a higher high and the slope of the 200dma remains down. Overall, my view of the S&P 500 remains neutral until further evidence can be gathered.
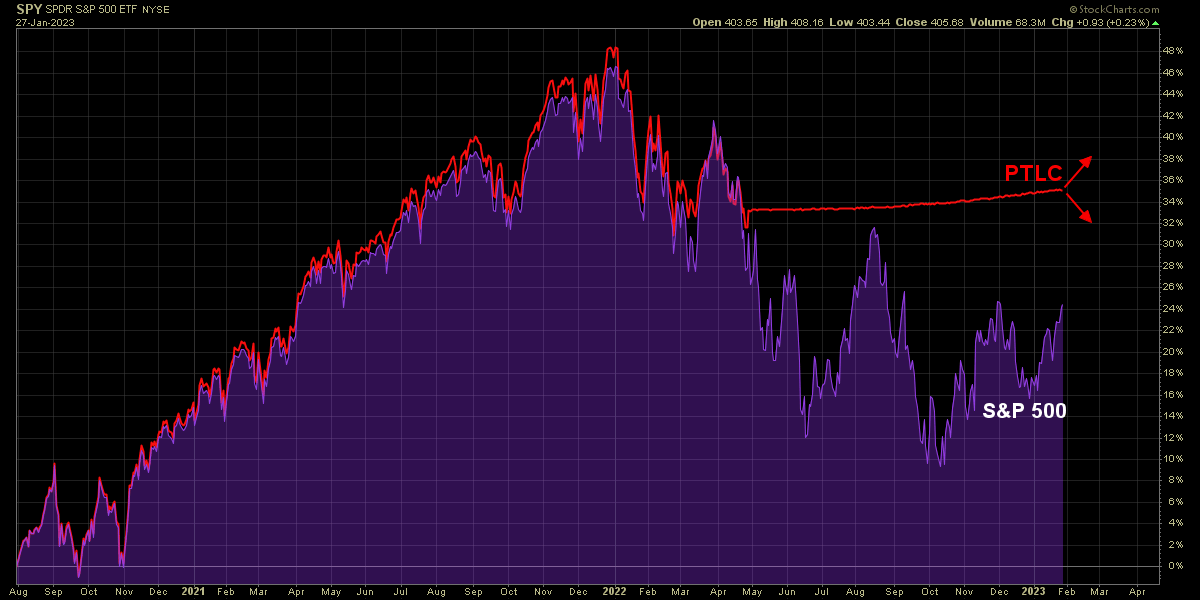
In a previous issue, I described an ETF that uses a systematic, rules-based approach to trade the S&P 500. Trading under the symbol PTLC, this fund has been defensively invested in T-Bills for the past 9 months.
Like a turtle hiding in its shell, PTLC was able to shield against most of last year’s bear market, but the question now is when will it come out again?
For the ETF to begin tracking the market again requires something very simple, clear and objective: five consecutive closes above the 200dma.
That actually occurred on Friday, so going into next week, PTLC will stop going sideways and begin tracking the S&P 500 again.
Interestingly, PTLC is not the only fund that does this. Another ETF that trades under the symbol PTEU implements the exact same strategy but this time for European stocks.
As the above chart shows, by playing superior defense, PTEU is now trading at a new high, while the typical European index is not. The fund outperformed not by making more money, but rather by not losing as much.
The point of mentioning these particular ETFs is not meant to be a recommendation to buy them. Instead its to highlight that Trend Following is about having a rules based system. It’s about reacting to what the market is actually doing rather than predicting what the market will do in the future.
Moving on, one major challenge that I’ve been experiencing this year with my trading is that while there are many stocks that are rising, momentum stocks aren’t budging.
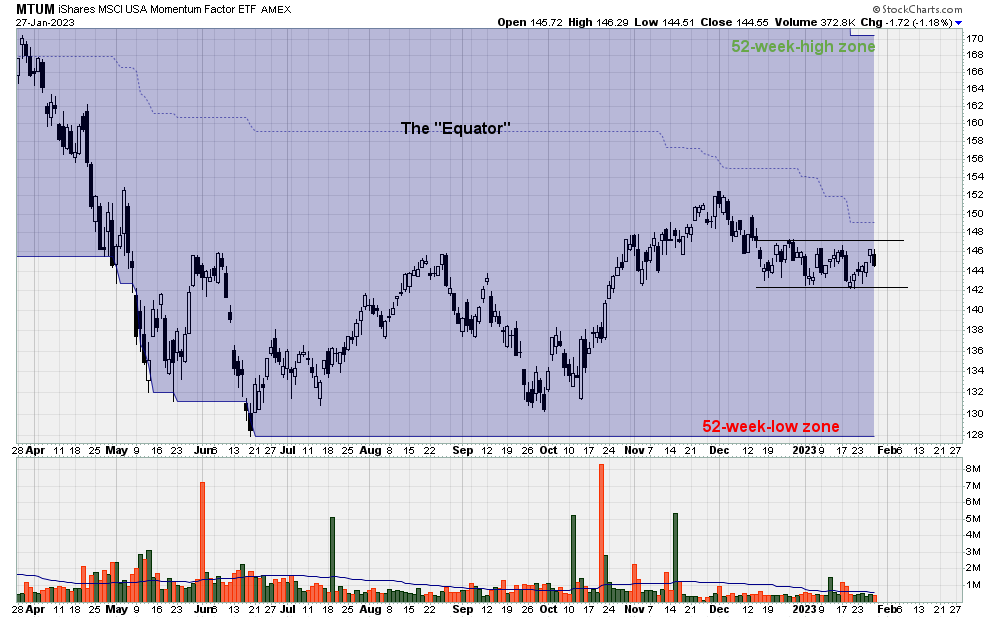
I mentioned last week that the momentum based MTUM fund can’t catch a bid and not much has changed since then. The price action continues to be trapped in a sideways range (black horizontal lines). So far this year, MTUM hasn’t even gained a penny. It’s completely dead.
I also mentioned last week that you can add a price channel (blue zone) to better visualize new 52-week-highs.
Price channels - also known as Donchian Channels for the great trader, Richard Donchian, who popularized them - contain three important zones.
The first (and most useful) is the 52-week-high zone which is the upper bound of the blue channel above.
The second is the dotted line in the centre that I don’t actually incorporate into my trading, but is also impossible for me to remove, so it’s always there regardless. This dotted line is the point that is equidistant from the 52-week-high and 52-week-low.
One way to think about this blue zone is to view the upper channel as akin to the North Pole on a map. Indicating a new 52-week-high, this is the most bullish zone possible.
Next, the dotted blue line, being exactly in the middle, would be akin to the Equator and represents a perfectly neutral area.
And finally, the bottom channel, being the 52-week-low zone, is analogous to the South Pole and represents the most bearish area.
Referring back to the aforementioned chart, MTUM is trading slightly “south of the Equator” and is correspondingly in a slightly bearish zone bordering on neutral.
To get a much more bullish looking chart of MTUM, we can rewind the clock all the way back to 2017 and the differences should be immediately obvious.
In particular, notice the constructive, tight base that formed in late 2016 and, importantly, how price subsequently printed a fresh new 52-week-high (red arrow).
After breaking through the North Pole, price printed another 52-week-high. And then another. And then another again, over and over.
Now that, dear reader, is a bull market. Contrast this genuine bull market against the performance of MTUM today and can you really blame me for not getting excited?
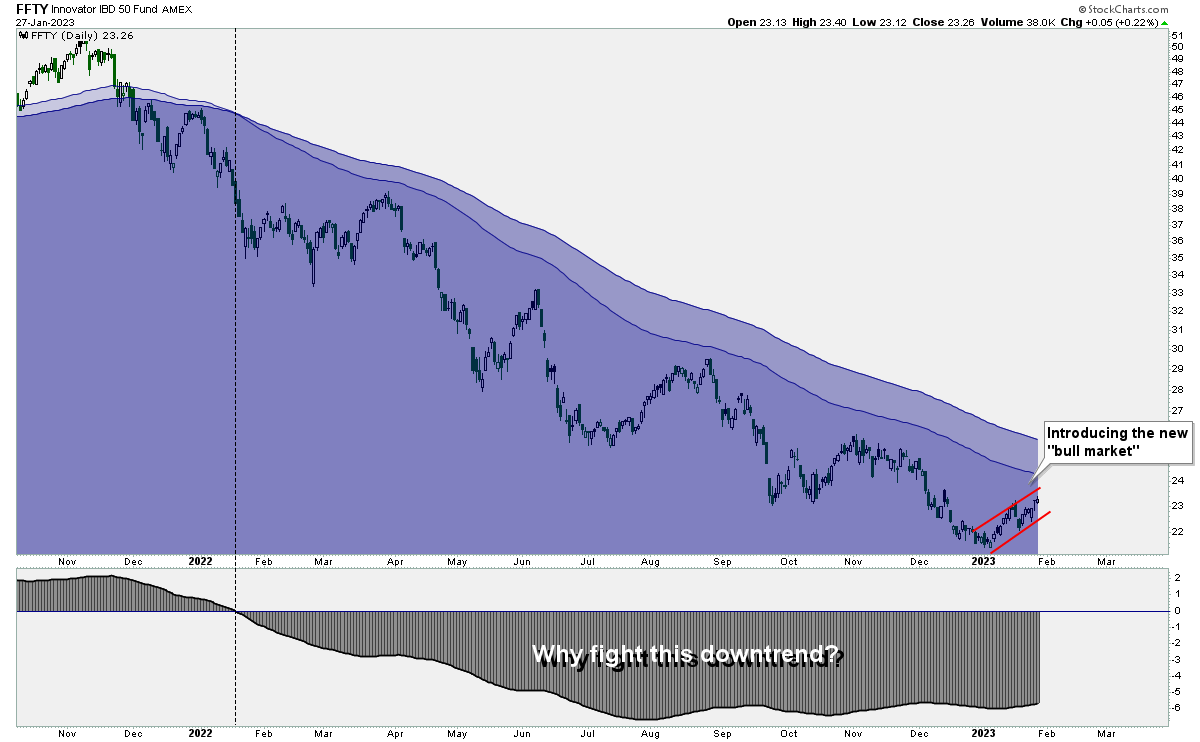
Furthermore, MTUM is not the only ETF that has been struggling recently. The IBD 50 fund of growth stocks has been drifting higher but, bigger picture, the long-term trend is clear.
In summary, despite some positive new developments, it’s very difficult for me to join the universal bullishness that I’m currently seeing on social media.
Short Selling:
Before delving into individual stocks, I need to take a moment to circle back to last week’s poll.
I thought I had been crystal clear, but based on the results of the poll, obviously there remains much confusion.
The most common answer selected was “Me”. That is incorrect. The correct answer is “You”. You are responsible for your investment decisions.
I fully appreciate that everyone learns at different rates but please, people, try to remember this fact going forward.
With this confusion (hopefully) out of the way, let’s talk about Tesla.
In a previous issue, I discussed TSLA as a possible short-sell candidate. This month, the stock rocketed higher by 44%. What a blunder!
Upon closer inspection, however, the trade wasn’t as bad as it appears. Firstly, the ideal short entry occurred when price made a fresh 52-week-low:
You want to short or buy closer to a base or a consolidation area. From there, price cascaded lower in December, moving further and further away from the original base, which, as labeled above, are not ideal short entries.
In terms of exiting the position, the 20-day-rule applies. When price breaches the 20ema (thin red line) you’d cover the position the next day. This handy little rule would’ve allowed you to avoid 100% of this week’s price advance.
Although I usually like to put my money where my mouth is, I actually never shorted TSLA. The reason is that I shorted a related stock called Rivian Automotive (RIVN) instead due to the fact that it was closer to an all-time-low, whereas TSLA was making only a 52-week-low.
Given a choice between two similar charts, I would always prefer the one making a new all-time-low (shorting) or all-time-high (buying).
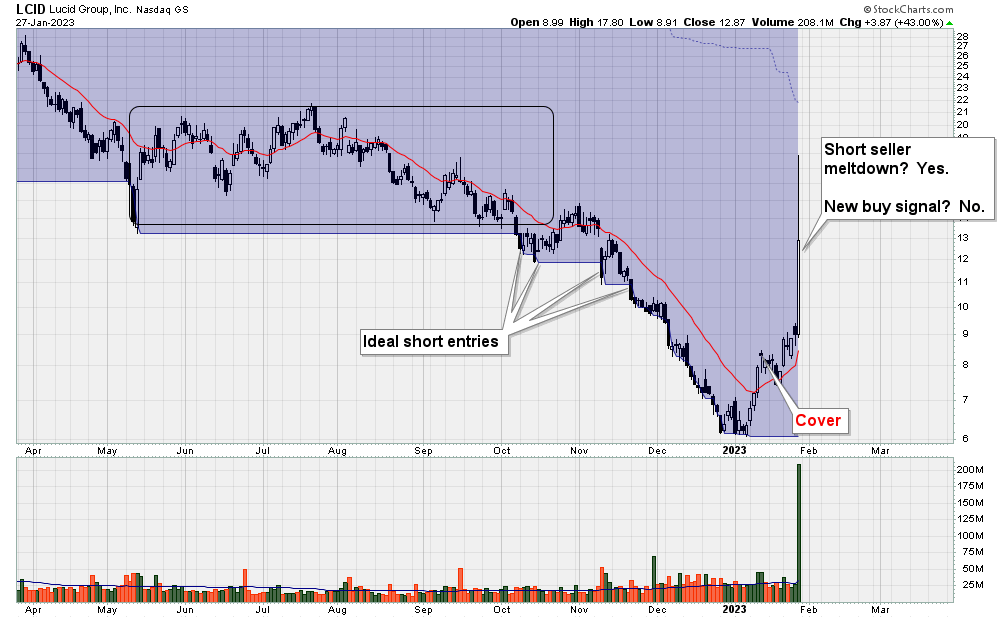
Moving on to another example, Lucid Group (LCID) formed a lengthy consolidation area (black rectangle) and then went on to trigger short signals when price printed fresh new lows:
Once again, the 20-day-rule keeps you out of trouble by covering the position prior to Friday’s manic 43% move.
This stock also highlights a general theme that I’m seeing this year: there are indeed many stocks making huge moves higher, yet they are the incredibly beaten down, most shorted names. In other words, there has been a mad “dash for trash” so far this year.
Now, a lot of new traders may regret not capitalizing on LCID’s 43% move on Friday, but if you’re a rules based trader, there is no shame in missing out.
I buy stocks that are making 52-week-highs. LCID is not making 52-week-highs, so my decision is simple. I would say that this week’s move was “interesting”, but it wasn’t a buy signal. No regrets.
Trend Following Discussion:
With a lack of direction in the stock market and also in a variety of other markets (such as Crude Oil), you might expect that a lot of Trend Following firms are struggling YTD.
For example, one of the best known Trend Following firms, Dunn Capital, is currently down 9.18% YTD as of Friday:
That being said, this fund posted a spectacular return of 60.29% last year, so these kinds of ups and downs are completely normal.
Similarly, the Trend Following ETF I previously discussed - DBMF - has also been slipping recently and is now underperforming the S&P 500 over the past 4 years:
With this underperformance in mind, you might think it’s not really worth bothering with all the complexities of Trend Following, however it’s not just about the rate of return.
Trend Following offers something else besides positive returns: true diversification. Referring to the above chart, notice how DBMF (in purple) stood its ground during the COVID crash and also how it soared to new highs during the Russian invasion of Ukraine. Importantly, DBMF not only produced positive returns, it did so with almost no correlation to the market.
Because DBMF is a Trend Following system and because the S&P 500 is also a Trend Following system, combining both together in, say, a 50/50 mix improves risk-adjusted returns dramatically.
Current Holdings:
Here are my holdings going into next week:


